Hedge mode explained
Available in FCC_EA Trading Panel Pro
Trading Panel Pro has hedge mode without the failed-break reset, which is FCC_EA only.
Hedge mode replaces the stop loss with a recovery sequence. Instead of closing a losing trade, FCC_EA opens an opposite trade with a larger lot when price reaches the hedge zone. If price then turns again, it opens the next opposite trade at the original entry, and so on. All these positions form a basket that is closed together as soon as it is back at breakeven or at your profit target, or when the loss reaches your hard stop in money.
Every cycle makes the open position larger. In a market that swings back and forth between the entry and the zone without breaking out, the basket grows quickly. The hard stop (Hedge Hard SL) is what limits the loss: set it to an amount you accept to lose on one basket, and keep Max Hedge Cycles low. Test hedge settings on demo first.
Step by step
Settings: BUY 0.10 at 1.10000, Take Profit 500, Hedge Zone Distance 500, Hedge Lot Multiplier 2, Max Hedge Cycles 3.
| # | Price reaches | FCC_EA does | Buys / sells open | Net |
|---|---|---|---|---|
| 0 | Signal | BUY 0.10 at 1.10000, with TP, no SL. Places SELL STOP 0.20 at 1.09500 (the zone) | 0.10 / 0 | 0.10 buy |
| 1 | 1.09500 | SELL 0.20 fills: cycle active. TP removed from all positions, because from now on they close only together, as a basket. Places BUY STOP 0.30 at 1.10000 | 0.10 / 0.20 | 0.10 sell |
| 2 | 1.10000 | BUY 0.30 fills. Places SELL STOP 0.60 at 1.09500 | 0.40 / 0.20 | 0.20 buy |
| 3 | 1.09500 | SELL 0.60 fills. Last order (Max Hedge Cycles = 3): no more orders | 0.40 / 0.80 | 0.40 sell |
| 4 | 1.09000 | The basket is back at $0: FCC_EA closes all four positions (the default breakeven exit). With Hedge Take Profit set, the basket runs on to that target instead | 0 / 0 | - |
Each order makes its side Hedge Lot Multiplier times the other side. After the last order the basket waits for one of its exits.
If price goes straight to the take profit before the zone is reached, the trade closes normally and the waiting order is deleted.
The example above as a chart: every order fills at the entry or at the hedge zone, and its lot is sized so that if price keeps going its way for another 50 pips (500 points), the basket is back at $0 and closes. The risk is the back-and-forth: after the last order only Hedge Hard SL limits the loss.
Before the cycle starts
Until the first hedge order fills, the position is a normal trade: it has its take profit, and breakeven, trailing, partial close, grid and pyramid work as usual. If grid adds positions, the waiting hedge order is resized to match. Once the cycle is active, these modules stop for that slot; only the basket exits apply.
Below is one real FCC_EA trade on XAUUSD M3 (29-30 October 2026, demo account): the same steps as in the table above, with other numbers. Each picture is the chart at that step. Settings on this chart: lot 0.1, Take Profit 1500 points, Hedge Zone Distance 1000 points (a $10 move in gold), Hedge Lot Multiplier 2, Max Hedge Cycles 3, Hedge Take Profit $50, Hedge Hard SL $1000.
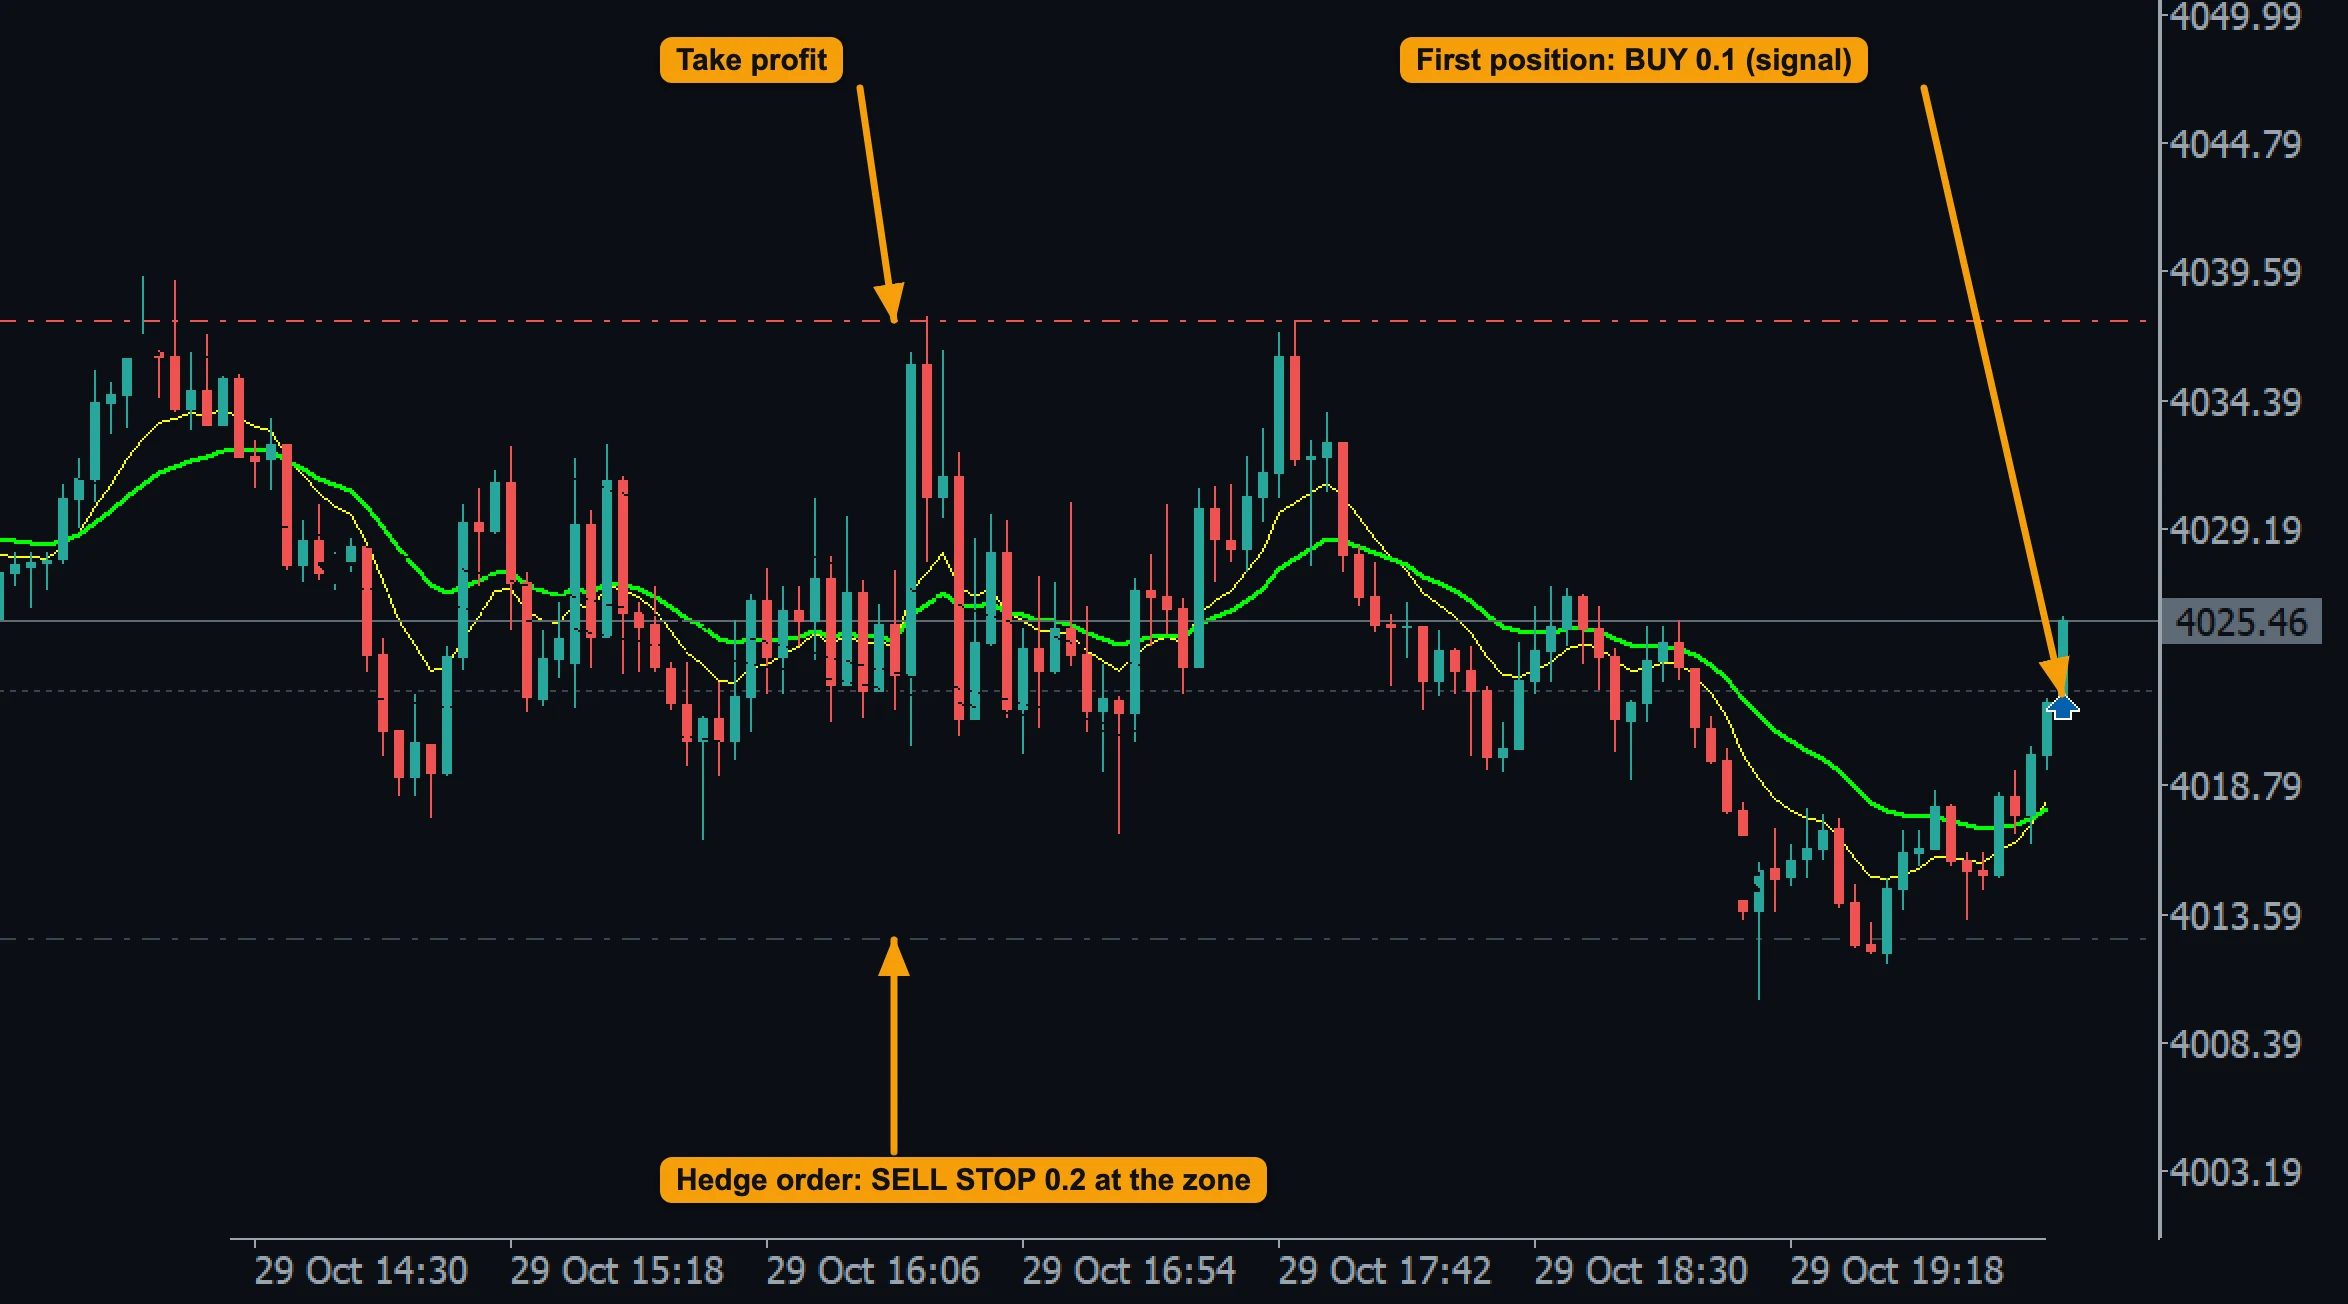
- First position: BUY 0.1 from a signal, with no stop loss.
- Take profit of the first position: a normal trade so far.
- Hedge order at the zone: a SELL STOP with twice the lot (Hedge Lot Multiplier 2), Hedge Zone Distance below the entry. The cycle starts when it fills.
During the cycle
Step 1: the first hedge order fills
Price fell to the zone 33 minutes after the entry and the SELL STOP filled. The slot is now in an active hedge cycle: from this moment its positions close only together, as one basket, through the basket exits. That is why FCC_EA removes the take profit of the first position: a single position closing on its own would break the cycle halfway. Then it places the next hedge order back at the entry price.

- Hedge SELL 0.2: filled at the zone, so the cycle is active.
- Take profit removed: the grey line shows where it was.
- Next hedge order: BUY STOP 0.3 back at the entry price.
- Breakeven price of the basket: below the price, because the basket is now net short (0.2 sold against 0.1 bought). If price falls to it, the basket is at $0.
Step 2: price returns to the entry
Two hours later price rose back to the entry and the BUY STOP filled. FCC_EA placed the next hedge order at the zone. The basket is now net long (0.4 bought against 0.2 sold), so its breakeven price jumped above the price: the basket gets back to $0 if price keeps rising to that line. If price turns down to the zone instead, the next hedge order fills.
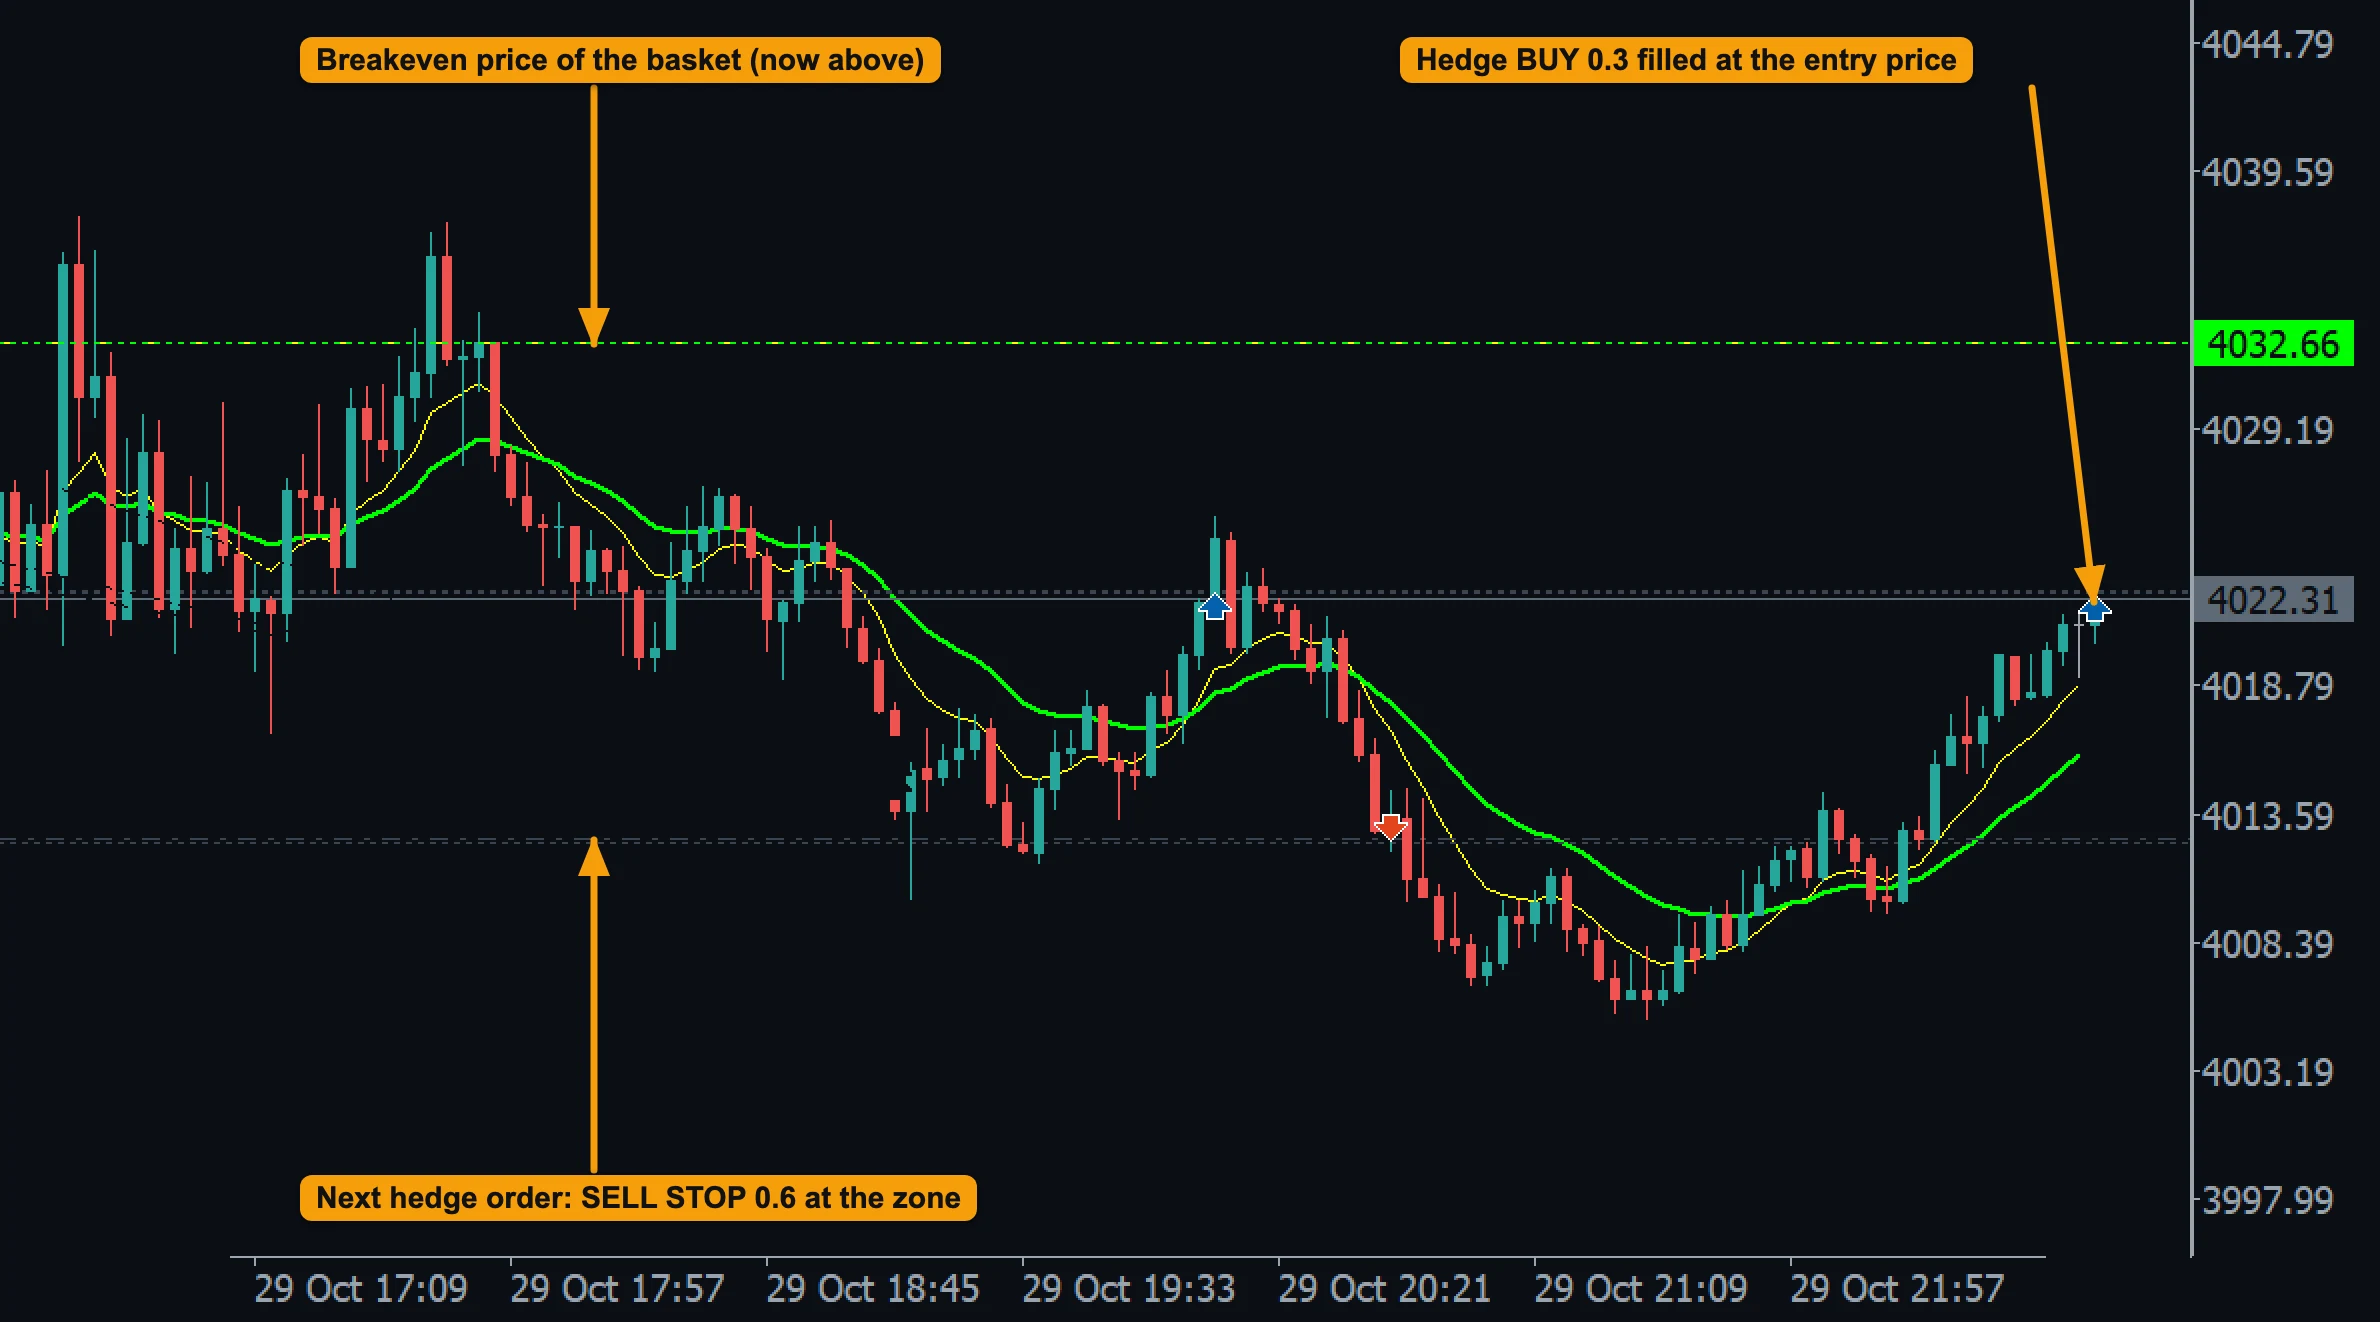
- Hedge BUY 0.3: filled at the entry price.
- Next hedge order: SELL STOP 0.6 at the zone.
- Breakeven price of the basket: now above, because the basket is net long.
Step 3: the last hedge order
Price fell to the zone again and the SELL STOP filled. This is the last order (Max Hedge Cycles 3): no new order is placed. The basket is net short (0.8 sold against 0.4 bought) and can now end only two ways: price falls further, past the breakeven price, to $0 or to Hedge Take Profit; or price rises back to the entry, where the loss grows quickly and only Hedge Hard SL ($1000 on this chart) stops it.
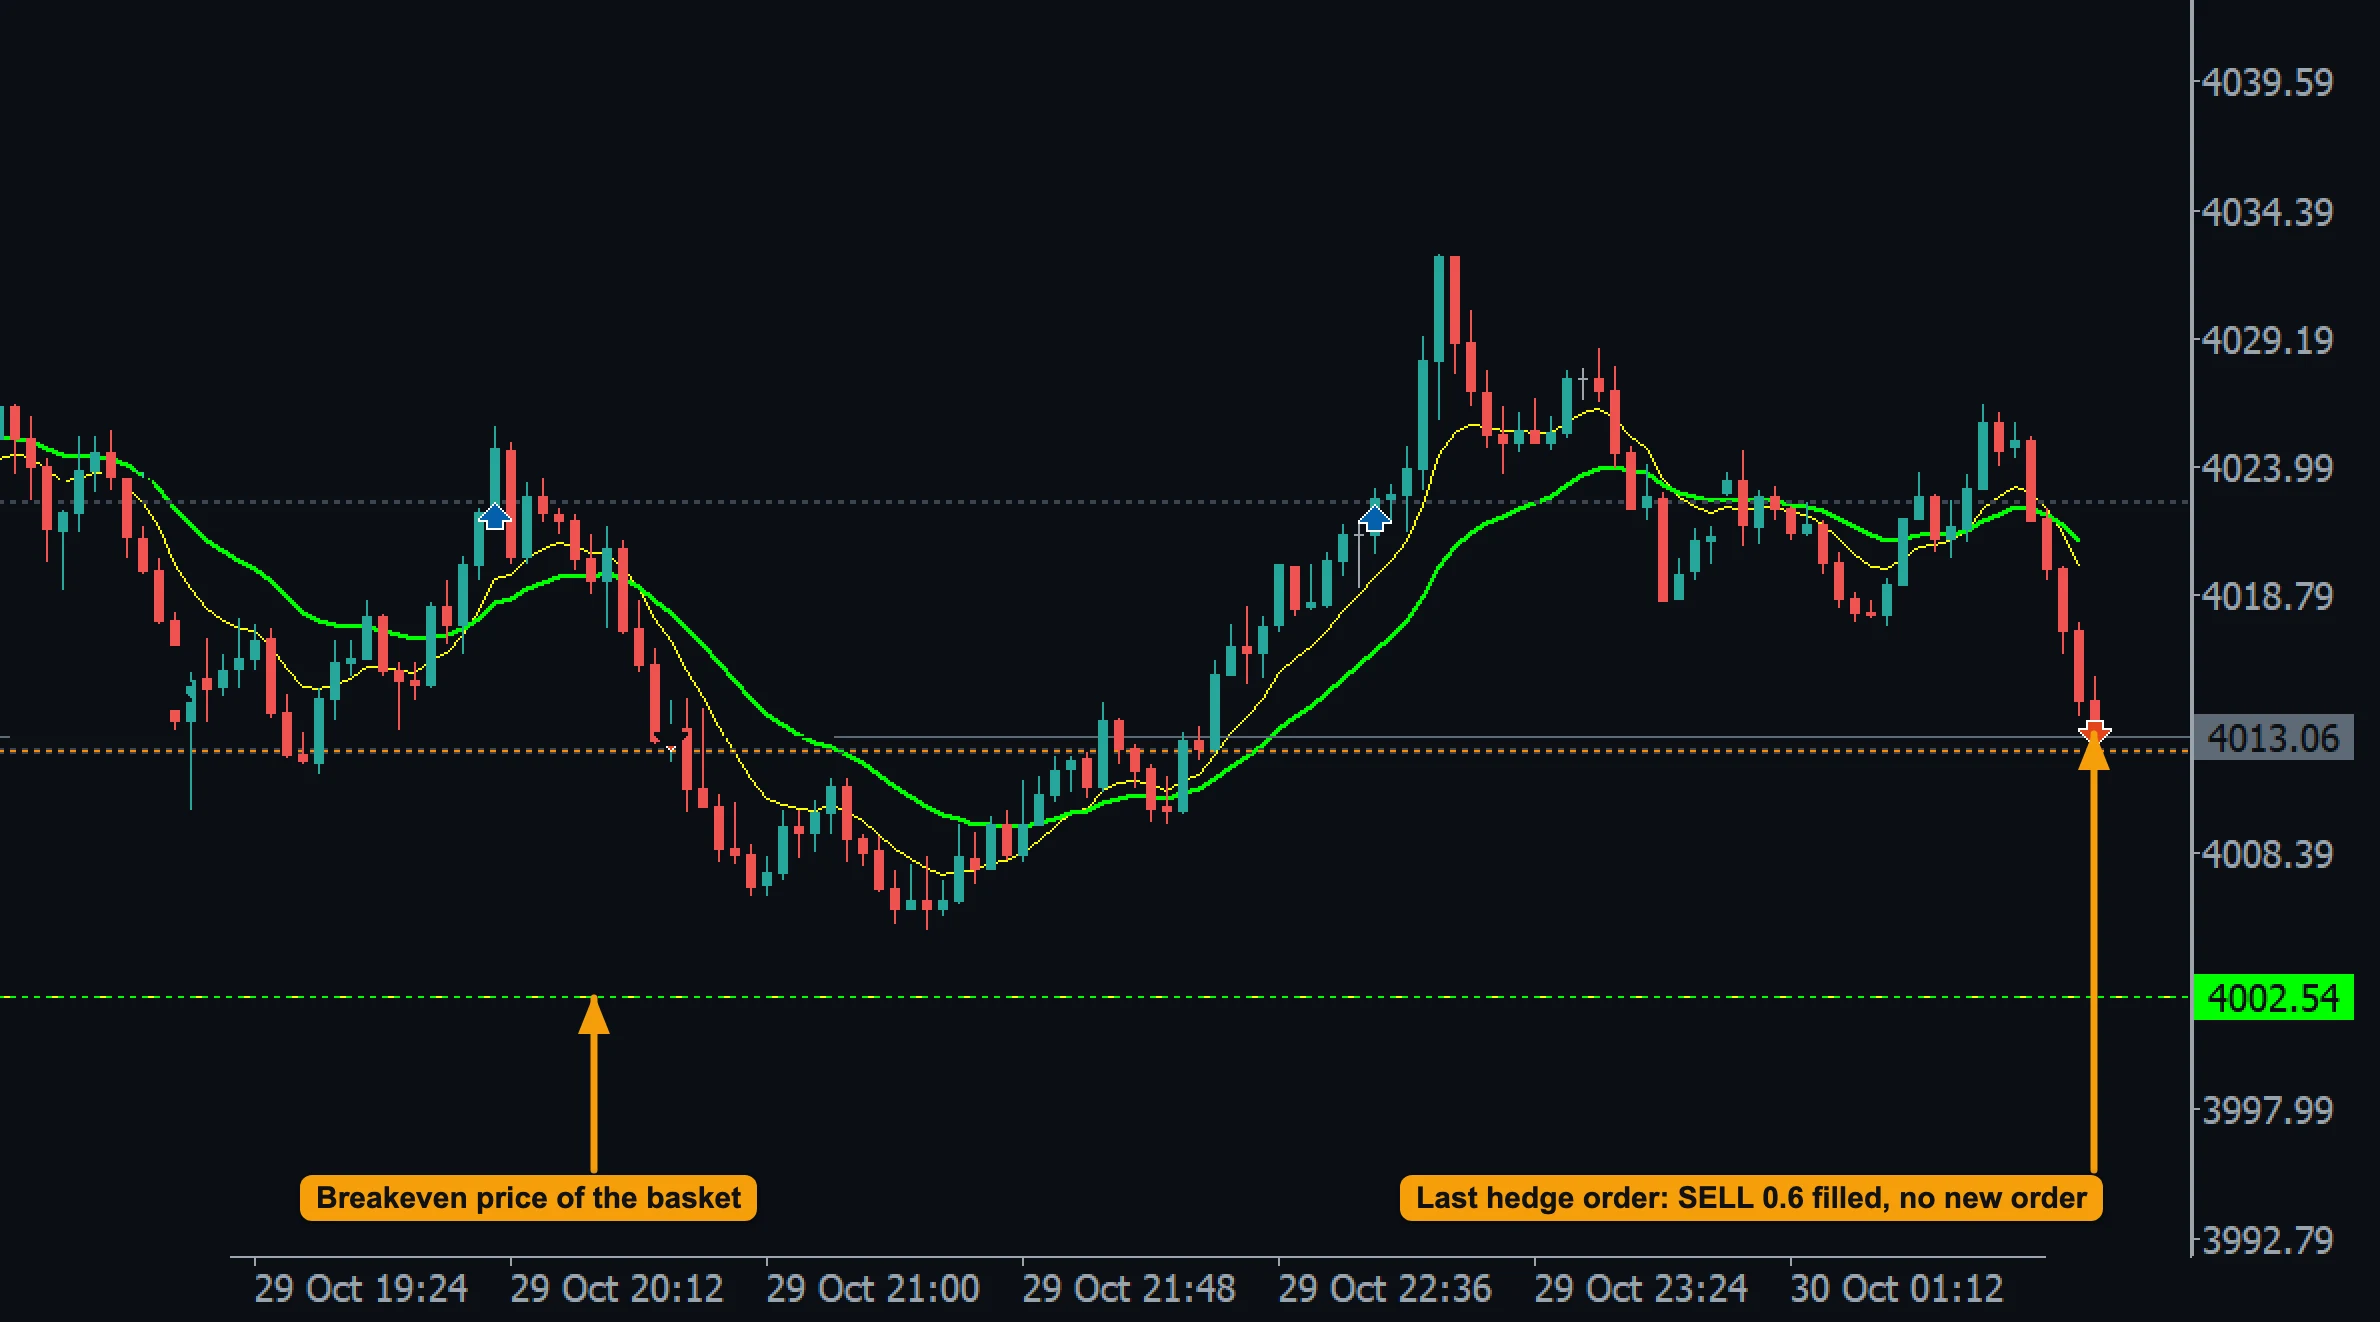
- Hedge SELL 0.6: filled at the zone, the last order, so no new order is placed.
- Breakeven price of the basket: below the price.
The basket closes
Price kept falling. It passed the breakeven price of the basket (the basket at $0), and because Hedge Take Profit was set to $50, the basket was not closed there but ran on. When its floating profit reached $50, FCC_EA closed all four positions together. The four closes filled a little lower than that moment, so their result was +$30.10; with swap (the trade stayed open overnight) and commission the basket ended at +$7.40. The first position alone would have lost $210.70 on this move; the hedge orders turned the trade into a small profit.
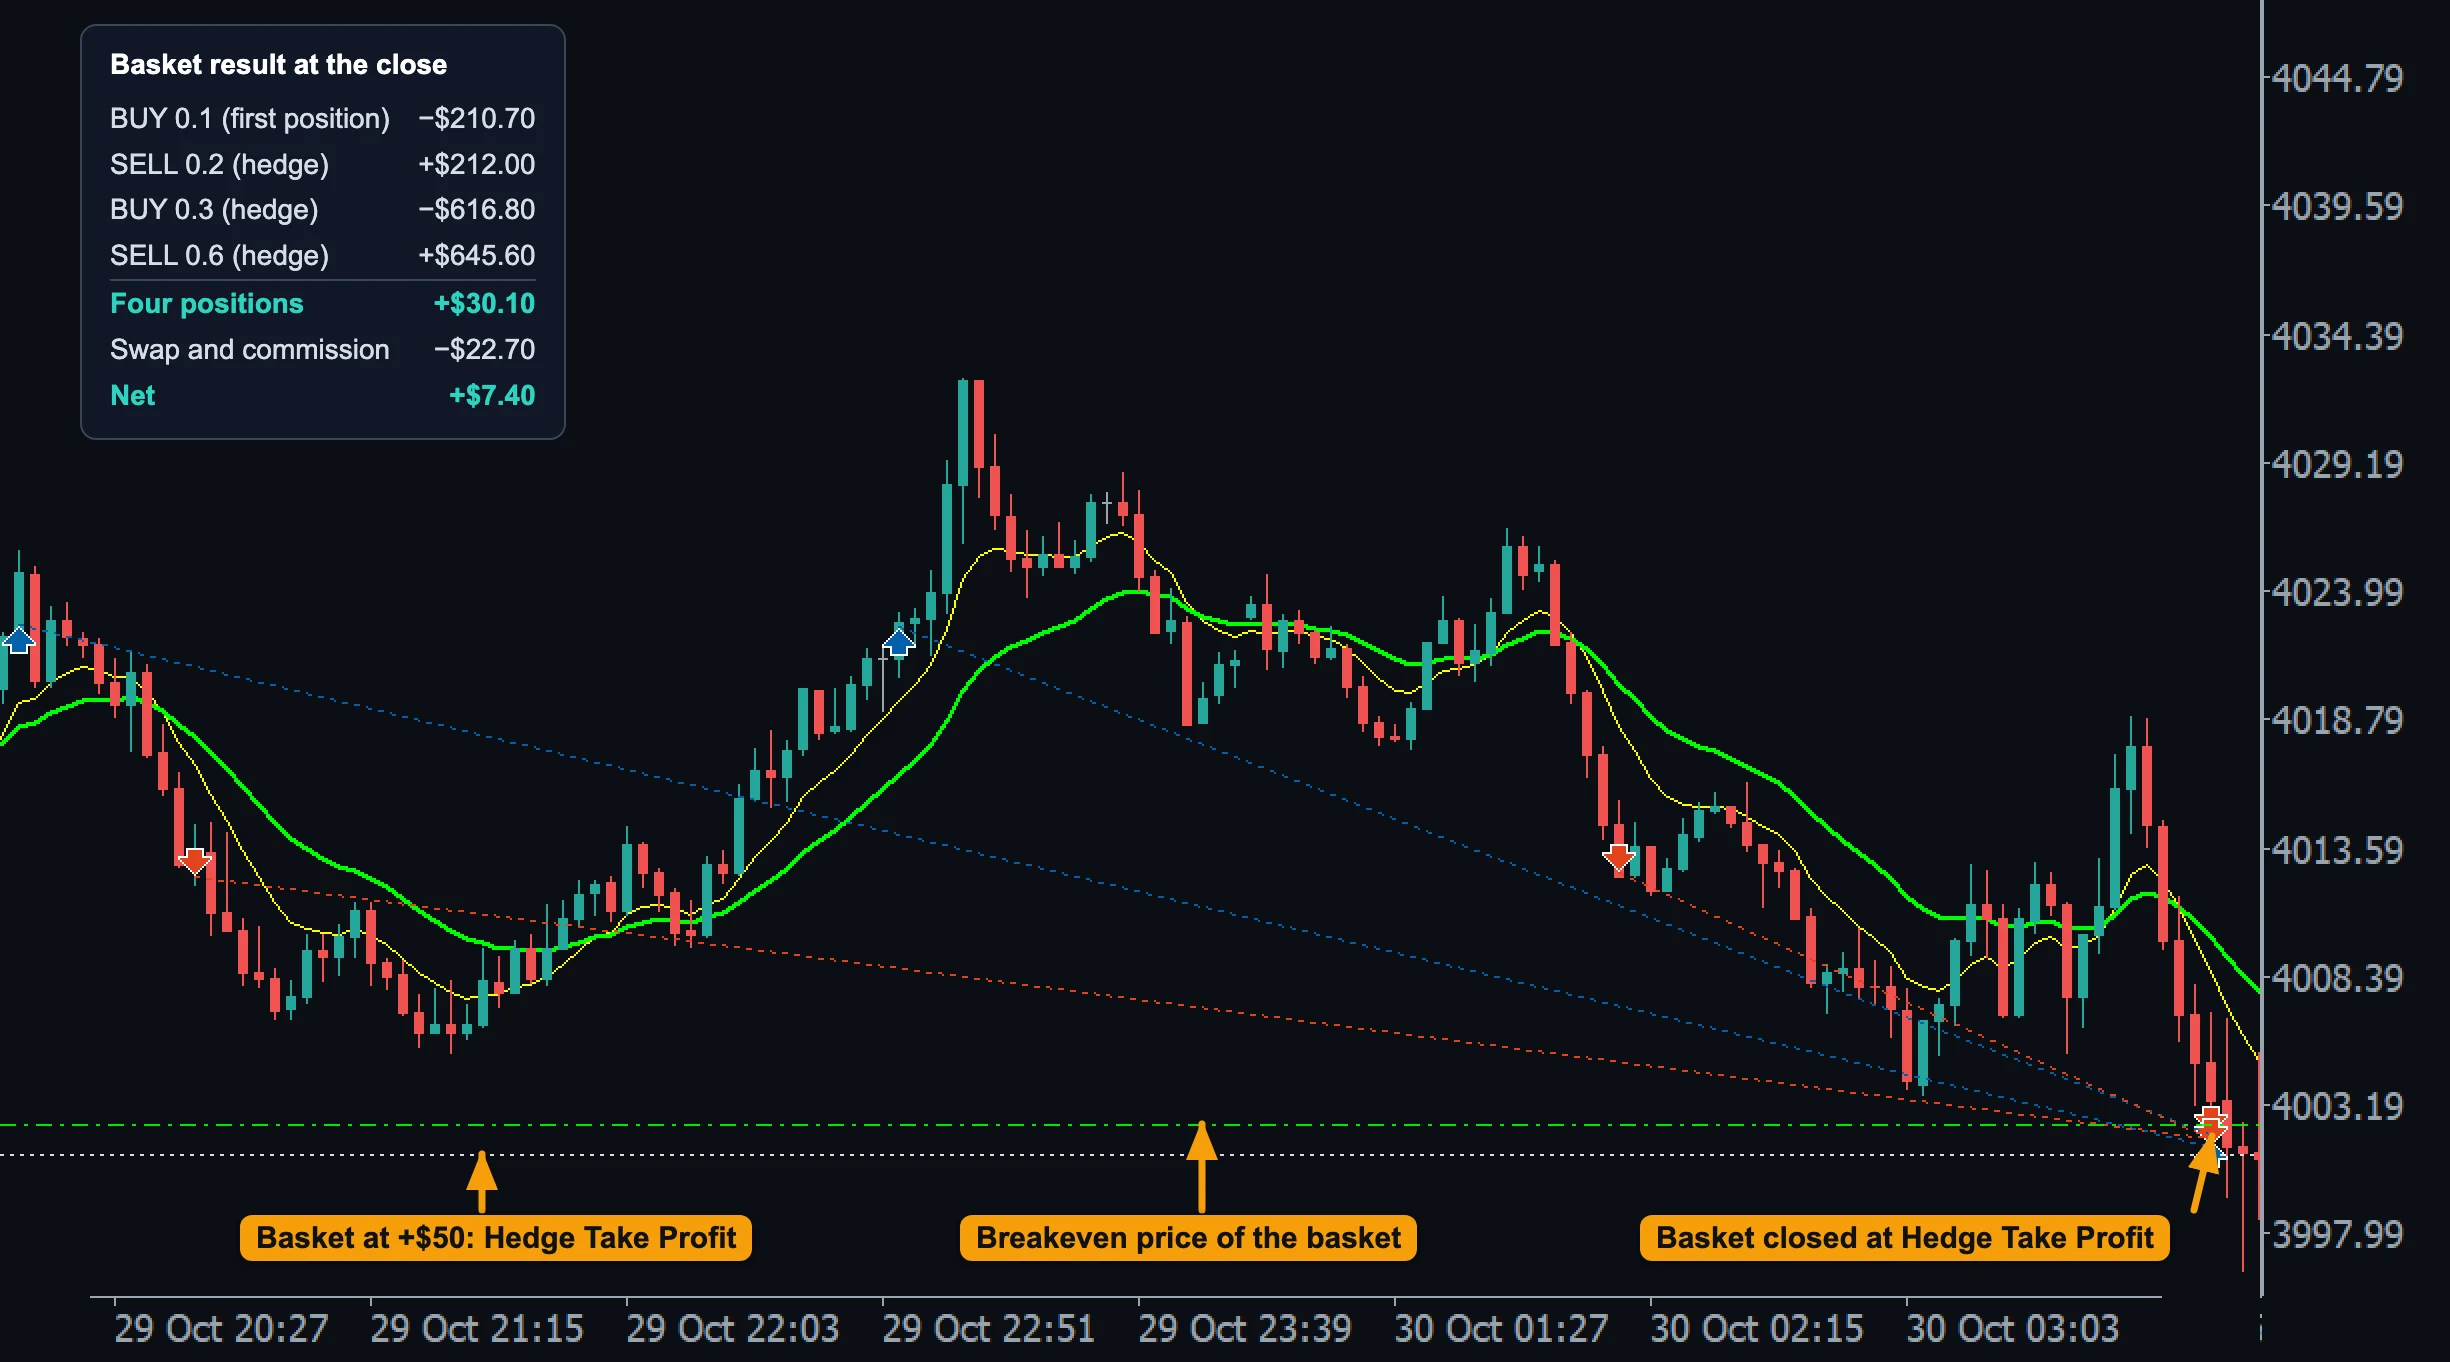
- Breakeven price of the basket: price fell through it, the basket at $0.
- Basket at +$50: the Hedge Take Profit set on this chart.
- Basket closed at Hedge Take Profit: the dotted lines of all four positions end at the same moment.
- Basket result at the close: BUY 0.1 −$210.70, SELL 0.2 +$212.00, BUY 0.3 −$616.80, SELL 0.6 +$645.60. Together +$30.10; swap and commission −$22.70; net +$7.40.
Basket exits
Checked on every price change while the cycle is active:
| Exit | Closes the basket when |
|---|---|
| Hard stop (Hedge Hard SL) | its floating loss reaches this amount (also before the cycle starts) |
| Take profit (Hedge Take Profit) | its floating profit reaches this amount |
| Breakeven (default) | its result is $0 or better, when none of Hedge Take Profit, Hedge Trailing Buffer and Hedge BE Protection is set |
| Trailing (Hedge Trailing Buffer) | after reaching $0 or better, it falls this amount below its best result |
| Breakeven protection (Hedge BE Protection) | price first moved this many points beyond the price where the basket reached $0, then came back to it |
With the defaults the basket closes at breakeven: the aim is to get out of a losing trade without a loss. To let a recovered basket run for profit, set Hedge Take Profit, Hedge Trailing Buffer or Hedge BE Protection, and optionally a partial close at breakeven (Hedge Partial Close at BE), which then leaves the rest running. With Hedge Take Profit alone a basket that touched $0 and turned back is not closed at $0 - it runs to the target or the hard stop, so pair it with Hedge Trailing Buffer for a give-back exit.
Example: Hedge Take Profit
The basket from the chart above after step 3 (net 0.40 sell, −$200), with Hedge Take Profit $100:
The cycle from the first chart with Hedge Take Profit $100: at BE the basket is at $0 but stays open, and it closes when its result reaches +$100.
The floating result includes swap, not commission.
Physical or virtual orders
With SL/Hedge Zone Timeout = 0 the hedge orders are real stop orders at the broker; above 0 they are virtual levels that FCC_EA opens at market after a timeout. See Virtual vs physical orders.
Failed-break reset
Optionally FCC_EA can undo a hedge step when price breaks the level and turns straight back. See Failed-break reset.
Alerts
Alert on Hedge Active sends a Telegram / push message when the first (or every) hedge order fills; the close alert of a basket says why it closed. See Telegram alerts.
After a restart
After a restart (terminal restart, settings change) FCC_EA continues the hedge cycle where it was.
All settings for this feature Hedge Mode settings → Manage Position settings → Alerts settings →
Backtest this setup free in the Strategy Tester, and adjust it whenever the market changes; every feature is in every plan. Backtest results depend on your broker's data and don't guarantee future results.
Check the FAQ or write to us. We reply within one business day.