Range Breakout method
Many markets build a quiet range before a busy period: before a cash open, or overnight. The Range Breakout method records the high and low of a time window and trades the move that follows.
How it works
- The window. During Range 1 Start–Range 1 End (for example
03:00–04:00) FCC_EA records the highest high and the lowest low, live, from one-minute candles. - The range is set when the window ends. From then until the end of the server day it can give signals.
- The signal comes from the trigger EMA (EMA Settings) crossing a range edge on a closed candle of the Signal Timeframe:
| Trigger | BUY | SELL |
|---|---|---|
| Cross Out (breakout) | EMA crosses above the range high, candle closes above it | EMA crosses below the range low, candle closes below it |
| Cross In (failed breakout, traded the other way) | EMA comes back up through the range low | EMA comes back down through the range high |
| Both | Either of the above | Either of the above |
Using the EMA instead of the raw price filters out single spikes through the range edge.
The range on the chart
FCC_EA draws the window and both range edges on the chart (Display Range Breakout Levels?).
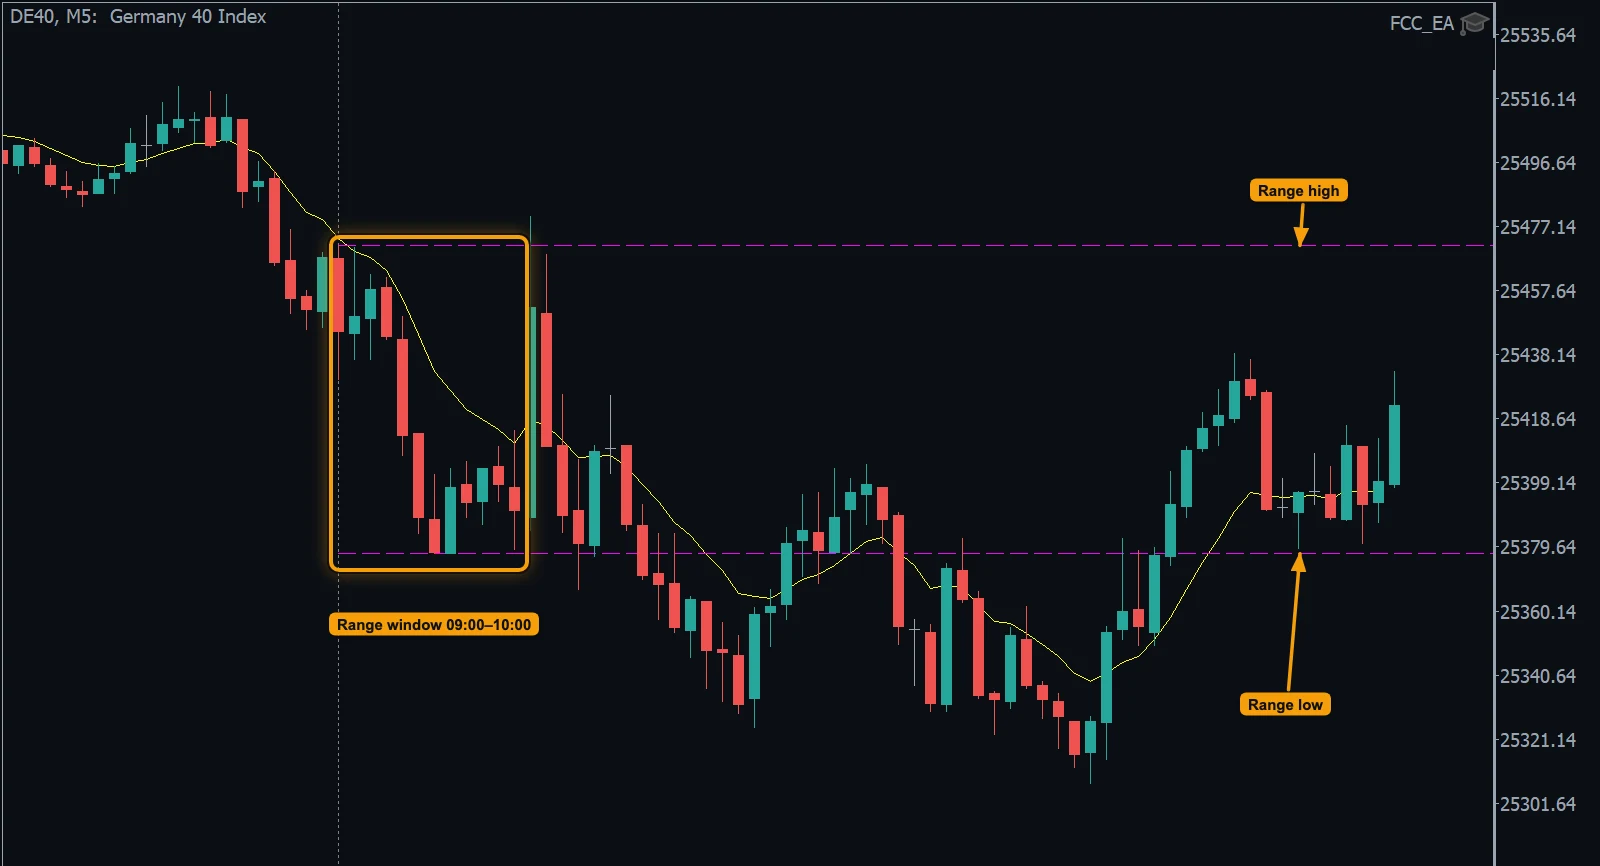
- The range window (here 09:00–10:00 server time): its highest high and lowest low become the range.
- Range high: the trigger EMA (yellow) crossing above it is a Cross Out BUY.
- Range low: the EMA crossing below it is a Cross Out SELL. Here price broke down and kept falling.
Example: Cross Out
A breakout traded in its direction.
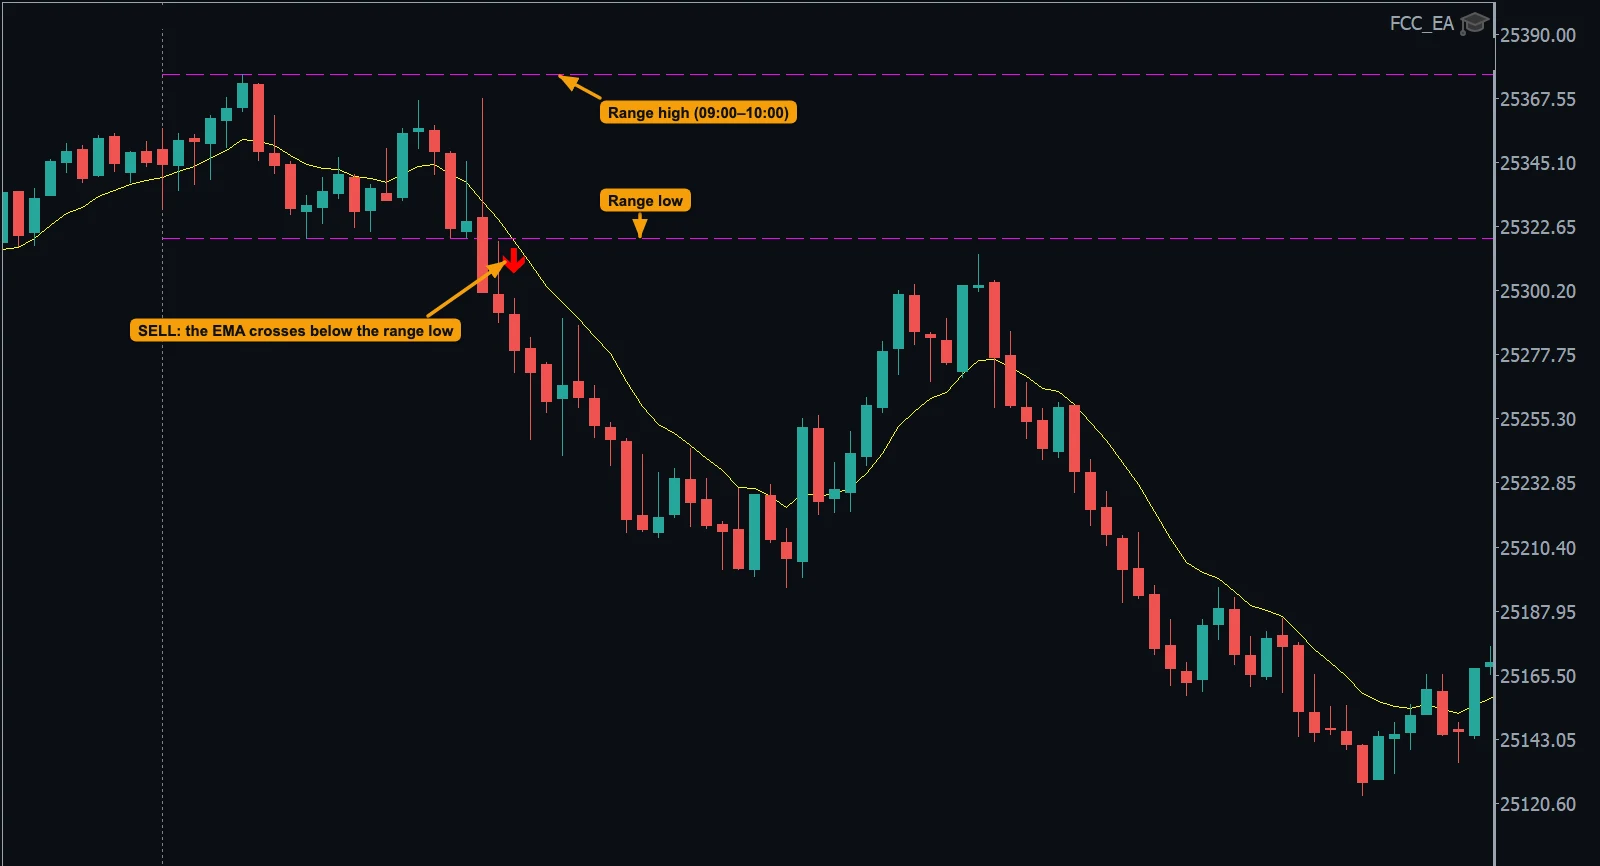
- The range high of the 09:00–10:00 window (the dotted vertical line marks the start).
- The range low.
- Cross Out: the trigger EMA crosses below the range low on a closed candle: SELL. Price then fell about 100 points.
Example: Cross In
A failed breakout traded the other way.
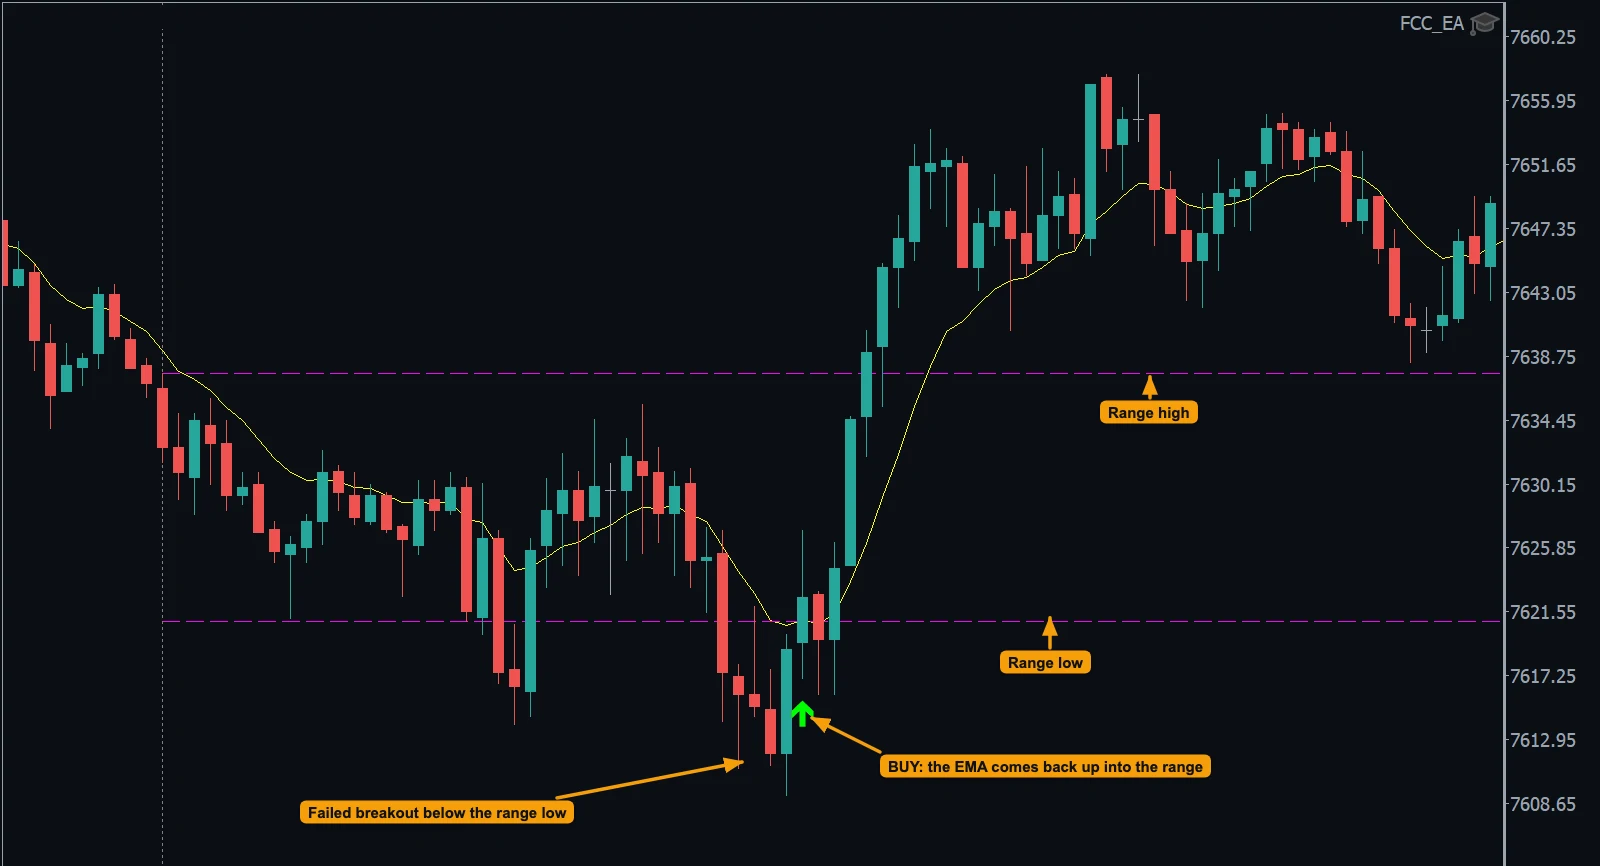
- The range high of the 15:30–16:30 window.
- The range low.
- The breakout below the range low fails.
- Cross In: the trigger EMA comes back up through the range low: BUY. Price then rose above the range high.
A second range
Range 2 Start / Range 2 End add a second window the same day, for example one before Europe and one before the US open. Active Range Only stops Range 1 signals once Range 2 is set, so only the newest range trades.
Limits and exits
- Max Trades per Day – Range 1 / Range 2: how many trades each range may give per day (-1 = no limit, 0 = this range is off).
- Close on Failed Breakout: closes the trade when the EMA crosses back into the range (a BUY when it falls back below the high, a SELL when it rises back above the low).
Times
Times follow Time Zone of All Time Inputs (OTHER SETTINGS); by default they are your broker's server time. A window must stay within one server day. The info panel shows the ranges as entered, for example Range1: 03:00-04:00 (EDT).
Seeing it
Display Range Breakout Levels? draws the high and low of each range. Use case: FCC_EA for opening range breakout traders — the range, the triggers and the controls on one page.
All settings for this feature Range-Breakout Signals settings → EMA settings →
Backtest this setup free in the Strategy Tester, and adjust it whenever the market changes; every feature is in every plan. Backtest results depend on your broker's data and don't guarantee future results.
Check the FAQ or write to us. We reply within one business day.