TMA Signals method
The TMA (triangular moving average) is an average of an average: a very smooth line that ignores small swings. The TMA Signals method offers two trend-following crosses and one reversal trigger.
VIDYA Cross
VIDYA is an adaptive moving average: it speeds up when the market moves and slows down when it is quiet.
- BUY: VIDYA crosses above the TMA and the candle closes above the TMA.
- SELL: VIDYA crosses below the TMA and the candle closes below it.
Because VIDYA slows down in quiet markets, it crosses the TMA less often in sideways periods than a plain EMA.
The lines on the chart
The TMA and VIDYA as FCC_EA draws them.
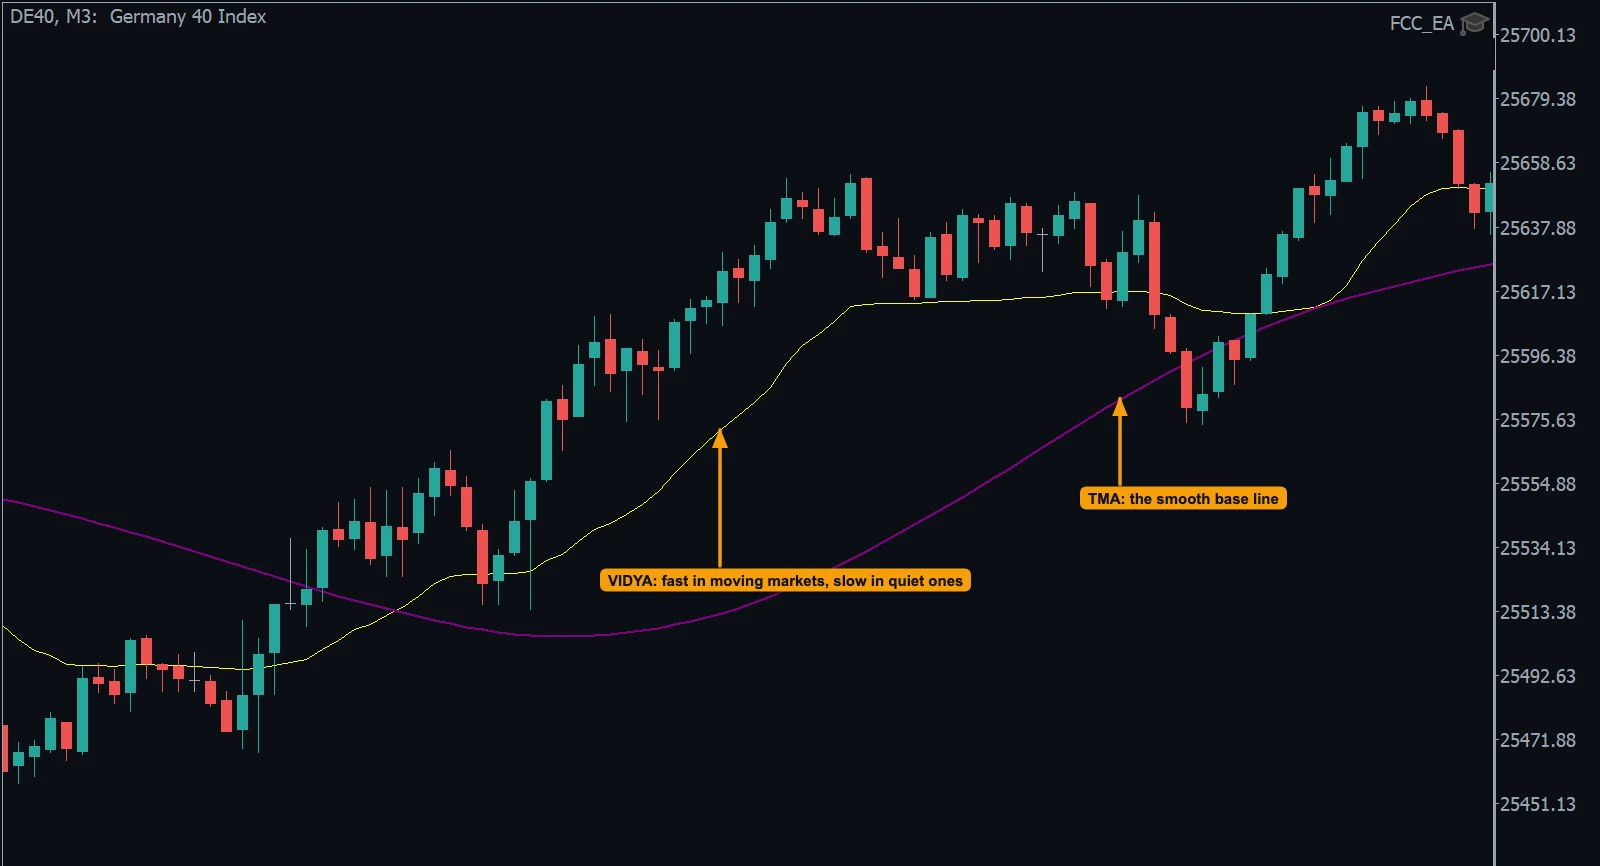
- TMA: the smooth base line.
- VIDYA: speeds up when the market moves, slows down when it is quiet.
Example
A VIDYA Cross BUY.
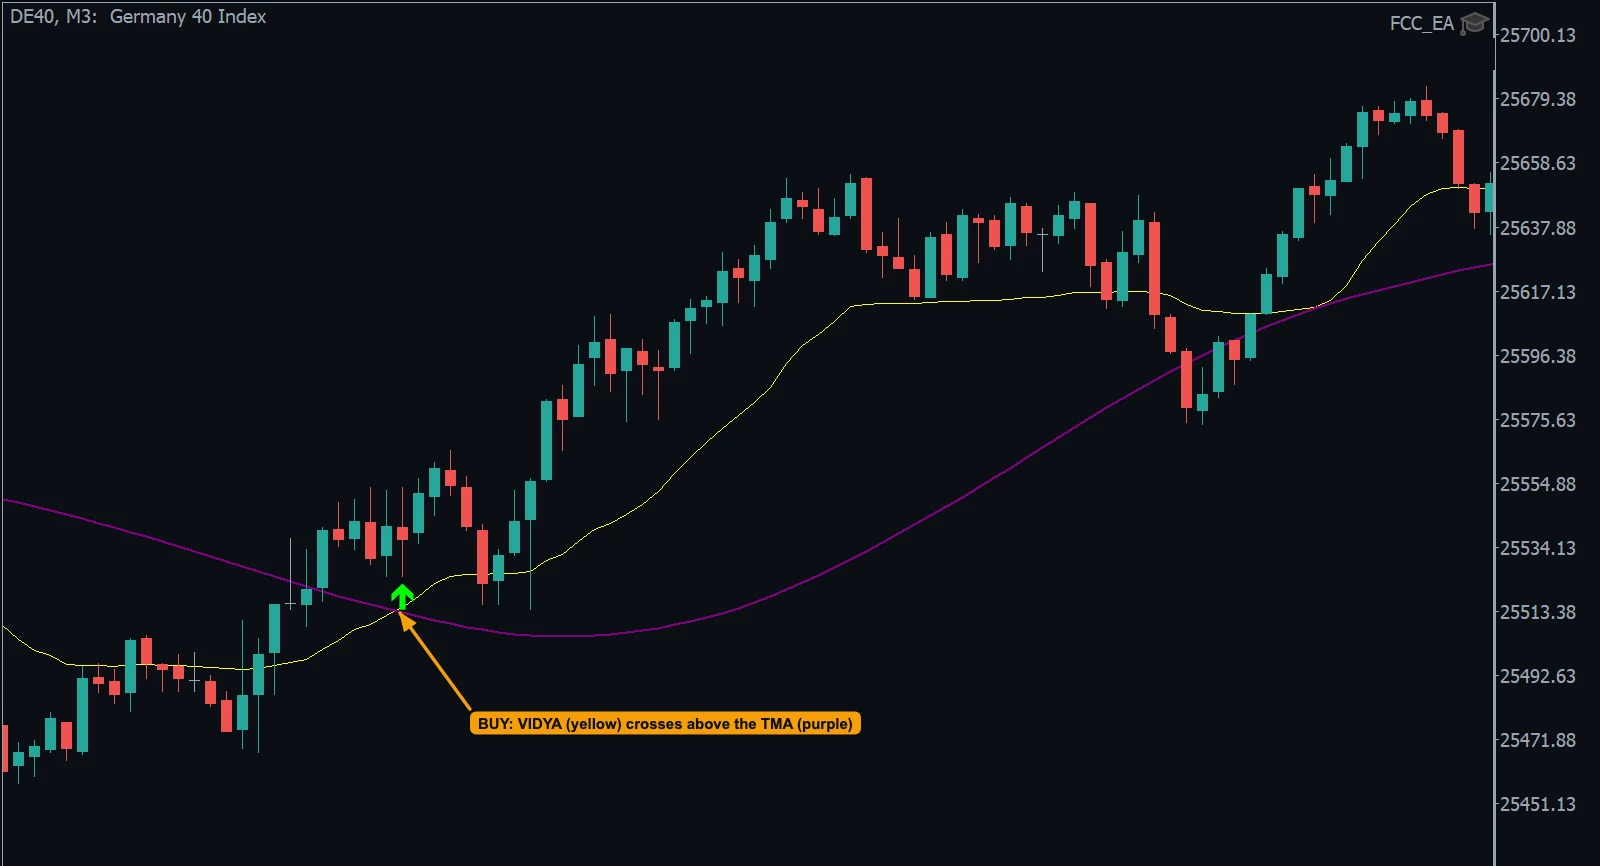
- BUY: VIDYA (yellow) crosses above the TMA (purple) and the candle closes above it; the uptrend follows.
EMA Cross
The same as VIDYA Cross with the trigger EMA (EMA Settings) instead of VIDYA. Faster, more signals. EMA Cross Confirm (FILTERS) can wait a few candles before entering.
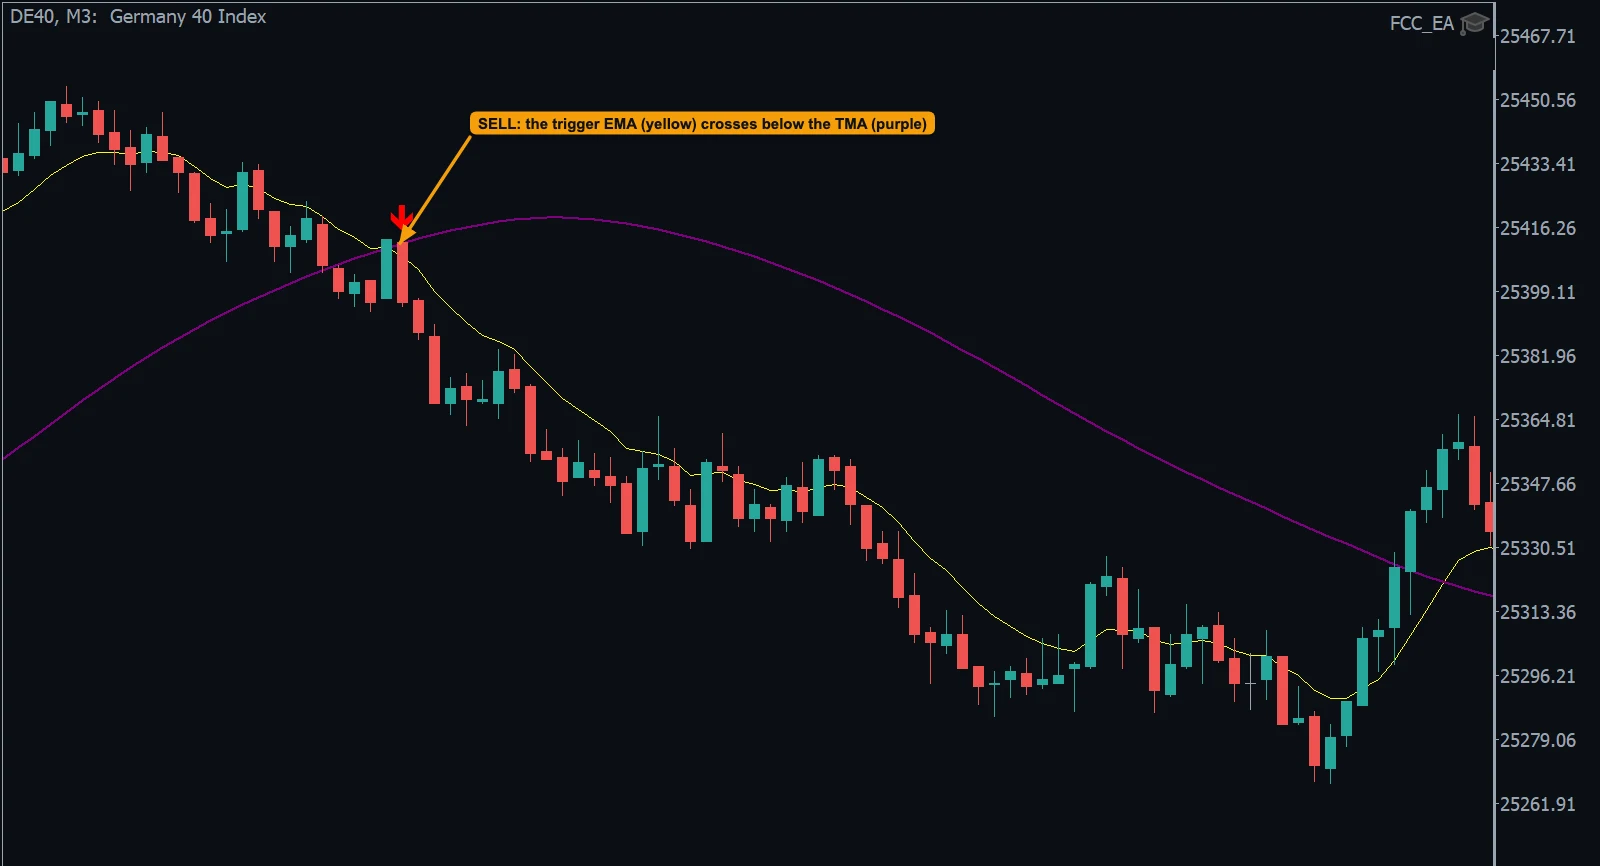
- SELL: the trigger EMA (yellow) crosses below the TMA (purple); the drop follows.
Band Reversal
Uses the TMA-Bands indicator: a centred TMA with an upper and a lower band. It looks for a push outside a band that is rejected:
- SELL: a bullish candle pushed above the upper band, and the next candle closed bearish.
- BUY: a bearish candle pushed below the lower band, and the next candle closed bullish.
The trend filter (Band Reversal: Trend Filter - Min TMA Move) skips reversals against a strong move: if the TMA rose more than that many points recently, SELL signals are skipped; if it fell more, BUY signals are skipped.
The bands on the chart
The centred TMA and its two bands.
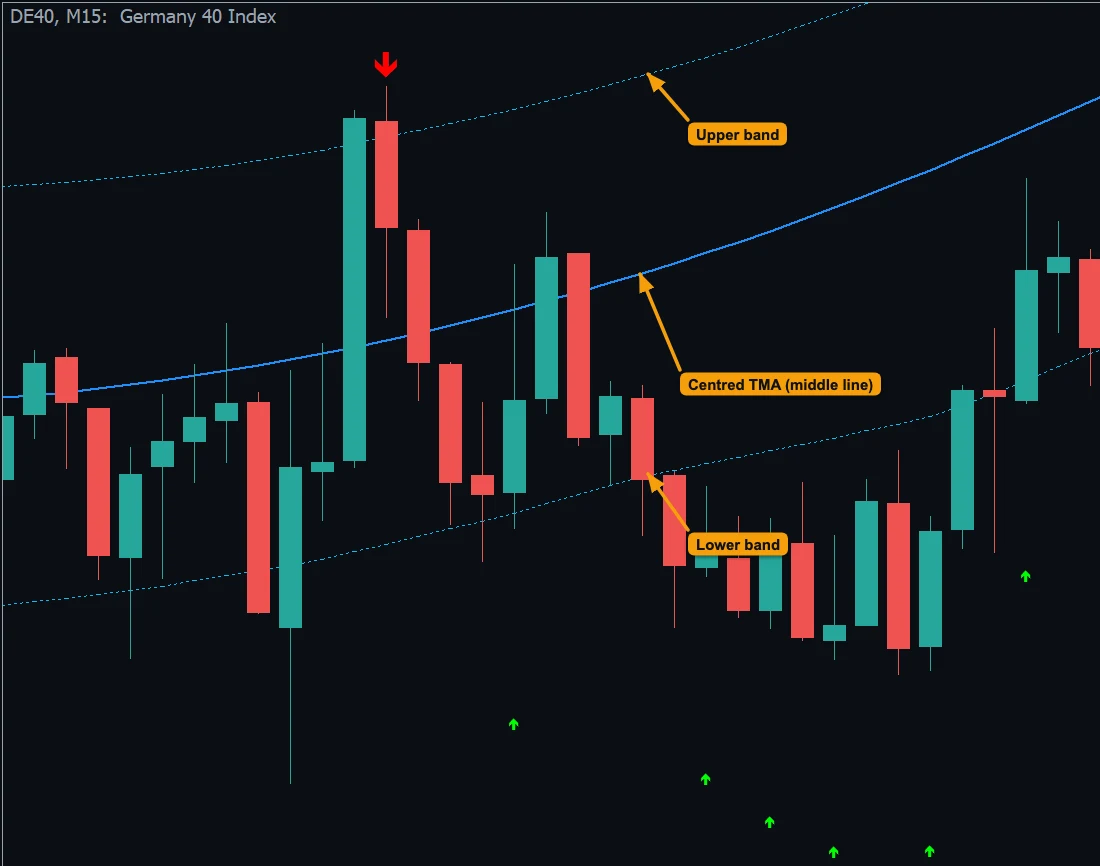
- The centred TMA (middle line).
- The upper band.
- The lower band.
The centred TMA uses candles on both sides of each point, so for the newest candles it is recalculated as new candles arrive. Bands and arrows of the last few candles on the chart can still shift. FCC_EA takes the signal when the arrow appears and does not take it back.
Example
A BUY at the lower band and a SELL at the upper band.
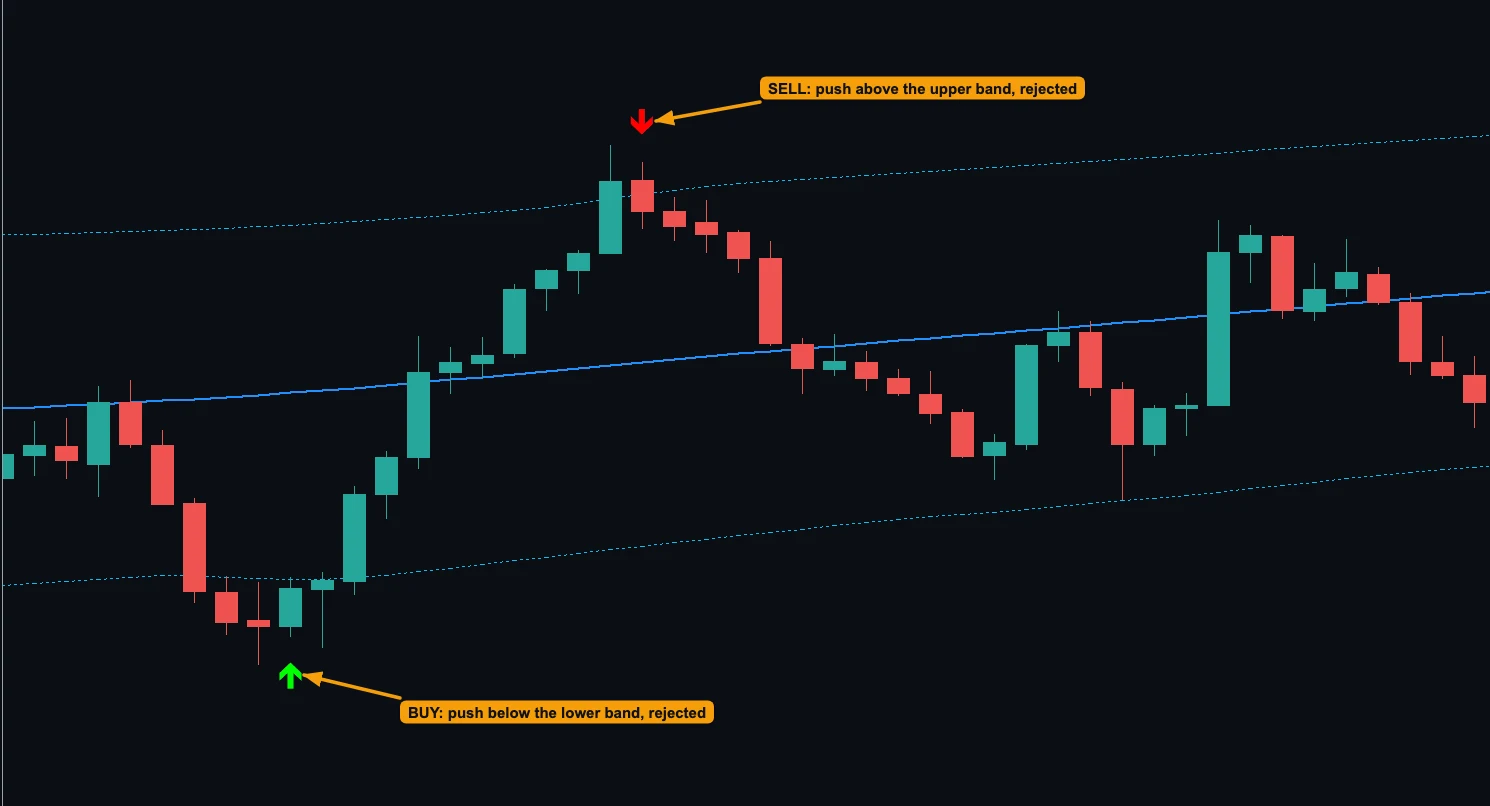
- BUY: candles push below the lower band and the signal candle closes back up to it; price then runs to the upper band.
- SELL: a candle pushes above the upper band and the next one closes back inside; price falls back to the middle line.
Here with Band Reversal: Bands Deviation 2.0: wider bands, fewer but more stretched setups.
Seeing the lines
INDICATOR LINES: Display VIDYA Line?, Display TMA Line? and Display TMA-Bands? (middle line, bands and arrows). Use case: FCC_EA for trend followers — the three TMA triggers next to EMA and SMMA.
All settings for this feature TMA Signals settings →
Backtest this setup free in the Strategy Tester, and adjust it whenever the market changes; every feature is in every plan. Backtest results depend on your broker's data and don't guarantee future results.
Check the FAQ or write to us. We reply within one business day.