VWAP Signals method
The VWAP (volume-weighted average price) is the average price of the session, where busy moments count more. Many traders watch it as the session's fair price. Around it FCC_EA draws standard-deviation bands (±1σ, ±2σ, ±3σ) that show how far price has stretched from that average.
The method mostly trades a return from a stretched band toward the VWAP: a lower band gives BUY, an upper band SELL. The VWAP line itself can also be traded.
The session
The VWAP starts from zero at every session start and builds up from one-minute candles. If the market is closed at the session start, for example when your session starts on Sunday evening and the broker opens later, the VWAP starts at the first candle after it.
| Session Start | Session End | Session |
|---|---|---|
00:00 | 00:00 | The broker's daily candle (default) |
16:30 | 00:00 | From 16:30 to the end of the daily candle, for example the US cash session on a broker whose server time is 7 hours ahead of New York |
16:30 | 23:00 | Exactly 16:30–23:00, not tied to the daily candle, so it does not shift when the broker's daily candle moves with daylight saving |
Times follow Time Zone of All Time Inputs (OTHER SETTINGS), so you can enter 09:30 New York time directly.
Before the first signal the method waits a warm-up of Warm-Up: Min Closed M1 Bars After Session Start one-minute candles, so the bands mean something. Outside the session there are no VWAP signals.
Triggers
Touch
Price reaches an enabled band: at or below a lower band = BUY, at or above an upper band = SELL, checked in real time. At the VWAP line: price coming down to it from above = BUY, coming up from below = SELL.
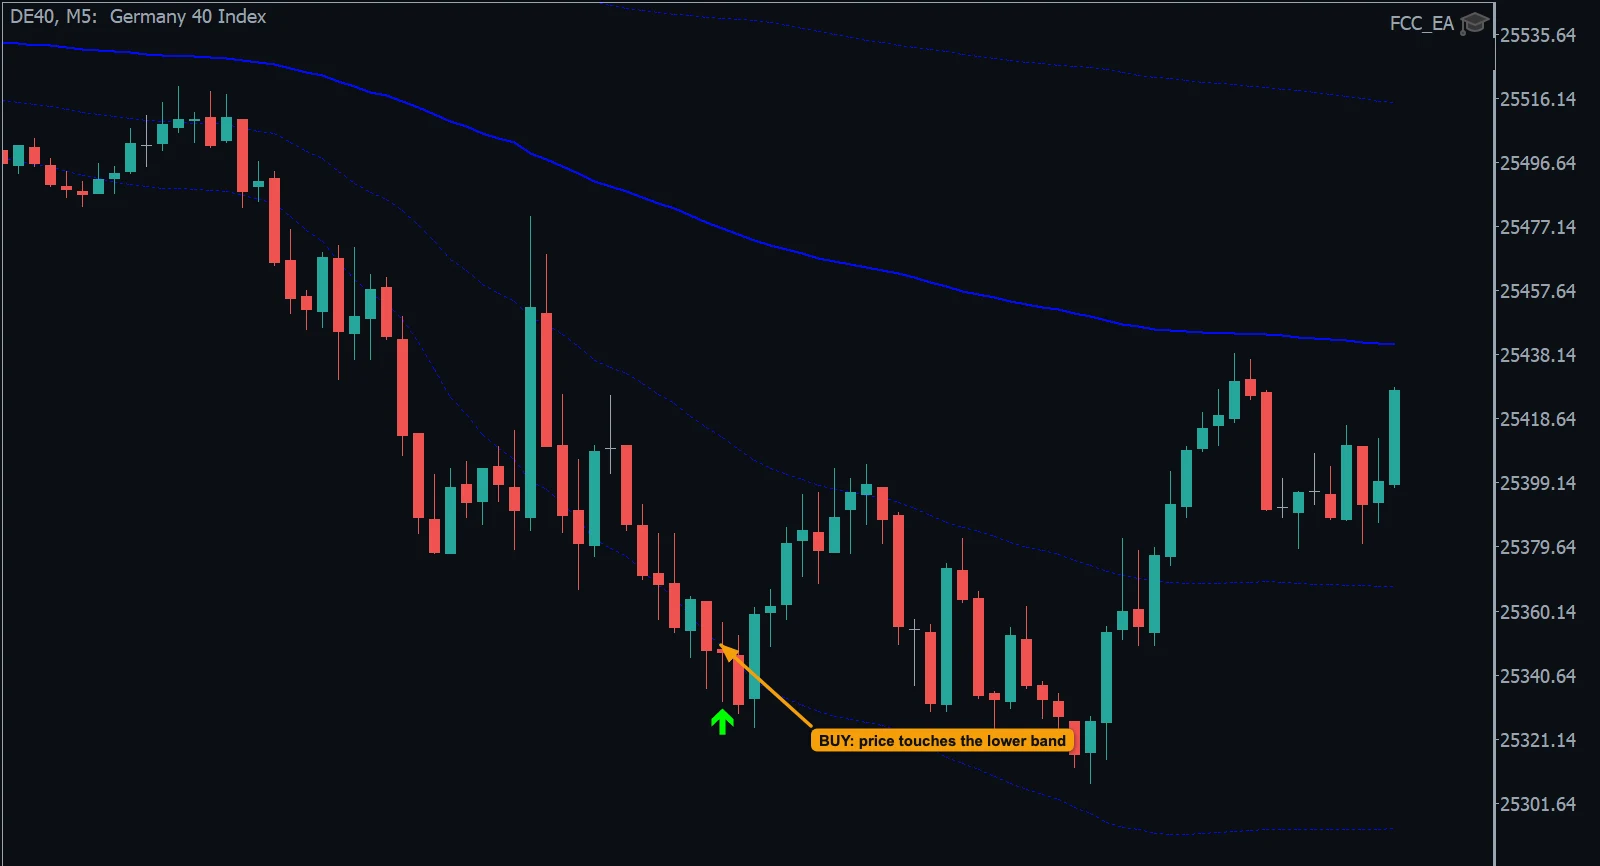
- Touch: price reaches the lower band and FCC_EA buys at once; the bounce follows.
Reclaim
Price breaks through a level, then a candle closes back inside: for example breaks below −2σ and closes back above it = BUY. See Reclaim Settings.
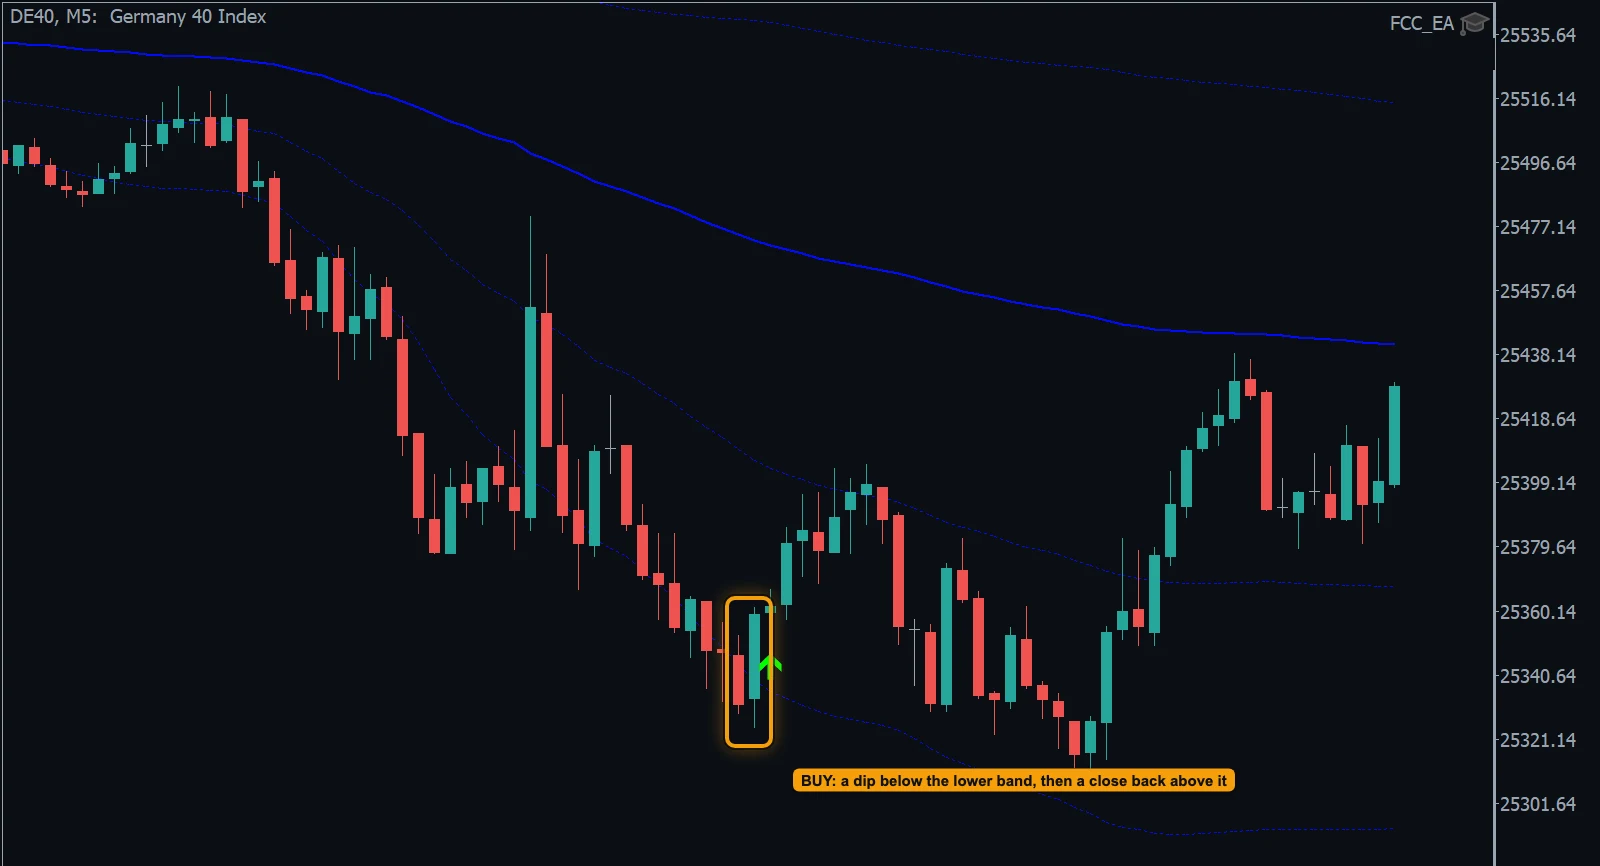
- Reclaim: one candle dips below the lower band, the next closes back above it: BUY.
EMA Cross
The trigger EMA crosses a level, compared candle by candle with the VWAP of that candle. At the VWAP line in both directions; at the bands only inward (up through a lower band = BUY, down through an upper band = SELL). Optional: close the trade if the EMA leaves the band again (Bands: Close on Failed Reversal?).
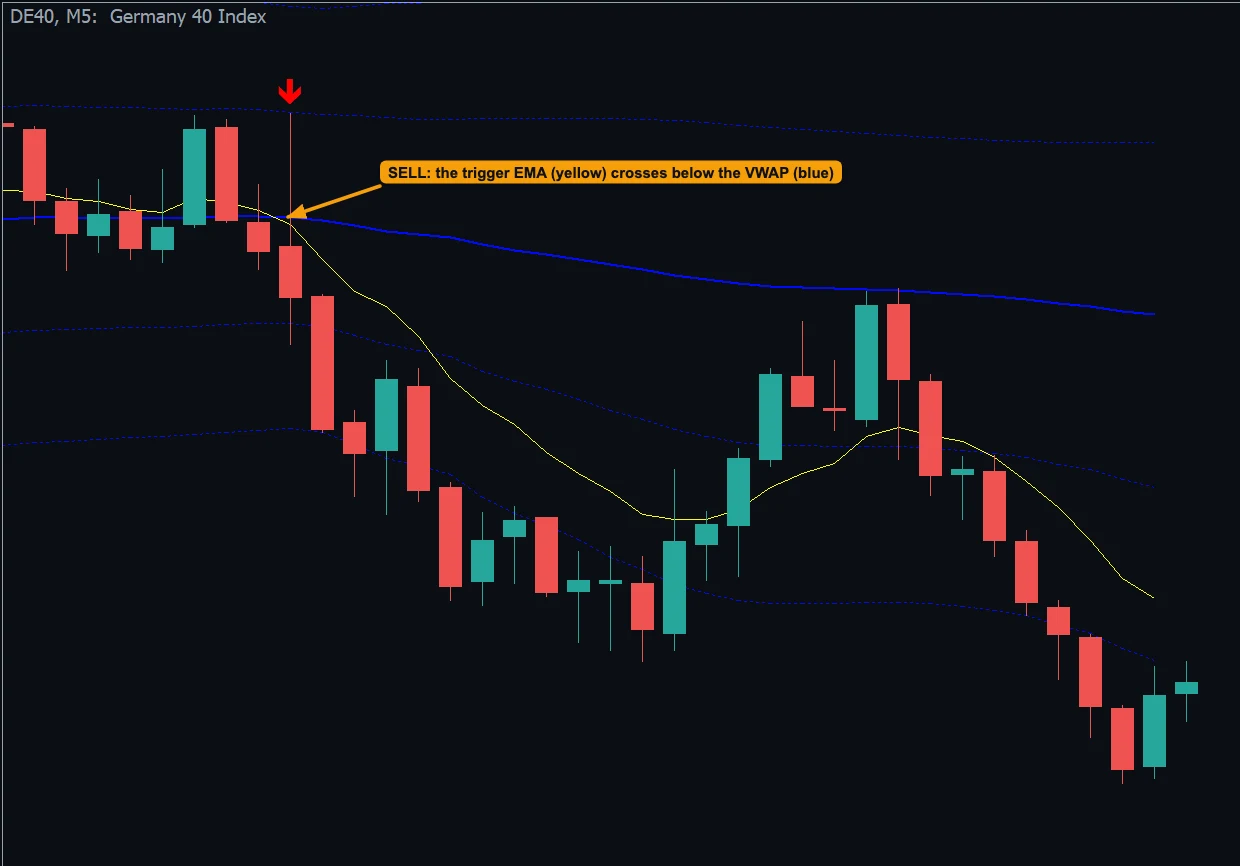
- EMA Cross: the trigger EMA (yellow) crosses below the VWAP line: SELL. Later price comes back up to the VWAP but the EMA stays below, so there is no new signal.
IFVG
An inverted fair value gap that forms at a band (lower = BUY, upper = SELL) or at the VWAP line. See FVG / IFVG Settings.
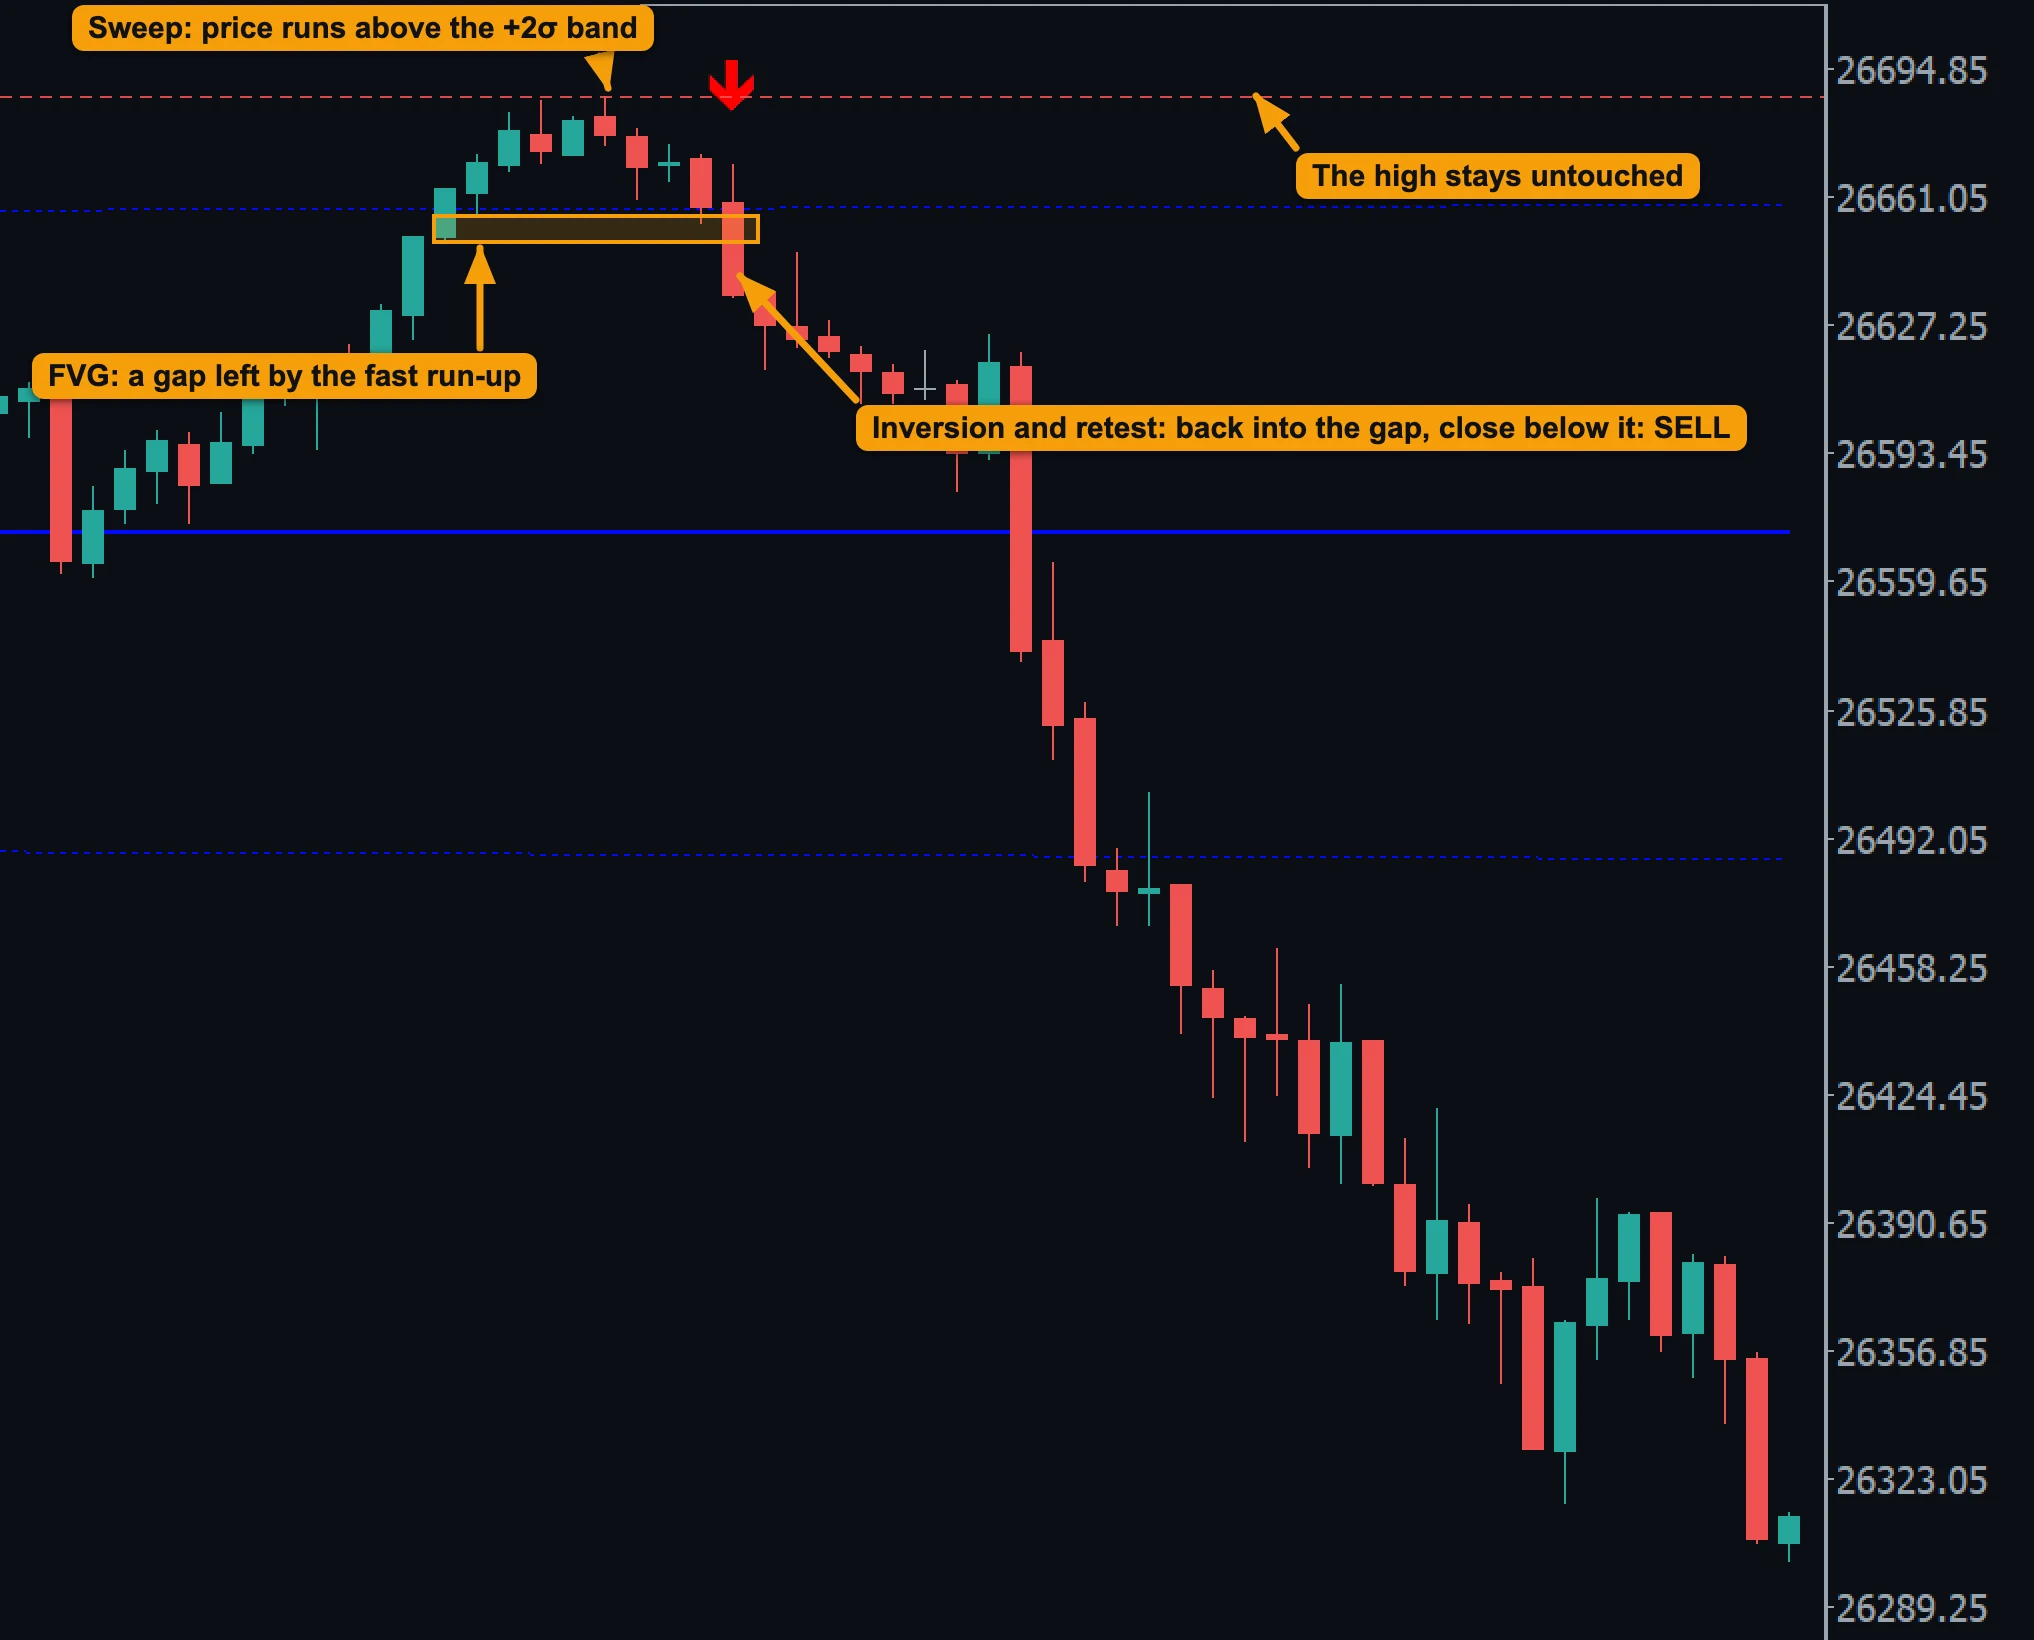
- Sweep: price runs above the upper +2σ band and makes a high there.
- FVG: the fast run-up left a gap (box) just under the band.
- Inversion and retest: price comes back into the gap and the candle closes below it, so the bullish gap turns into resistance: SELL (red arrow).
- The high stays untouched: a stop just above the sweep high (dashed line) is never reached. Price then fell from 26635 to about 26310.
On the chart, FCC_EA also marks gaps with boxes and the entry with a preview arrow; a grey arrow means the entry is blocked by a check (hover for the reason).
Choose the levels with Use VWAP Line, ±1, ±2 and ±3 StdDev Band: wider bands give fewer, more stretched setups.
The VWAP on CFD data
Most CFD brokers do not report the real traded volume, only the number of price changes. FCC_EA therefore weights each one-minute candle by a substitute (VWAP Bar Weighting); Bar range is the default and works best on CFD data. When the broker does provide real volume, it is used instead. Manual VWAP Shift can move the whole VWAP if you want to line it up with a reference chart.
VWAP as a filter
Independently of the signal method, VWAP Filter (FILTERS) allows BUY trades only above the VWAP and SELL trades only below it. It uses the session set here.
Seeing it
Display VWAP and Enabled Bands? draws the VWAP and the bands you enabled. In Reclaim mode a white dotted line shows where a candle has to close to confirm a reclaim.
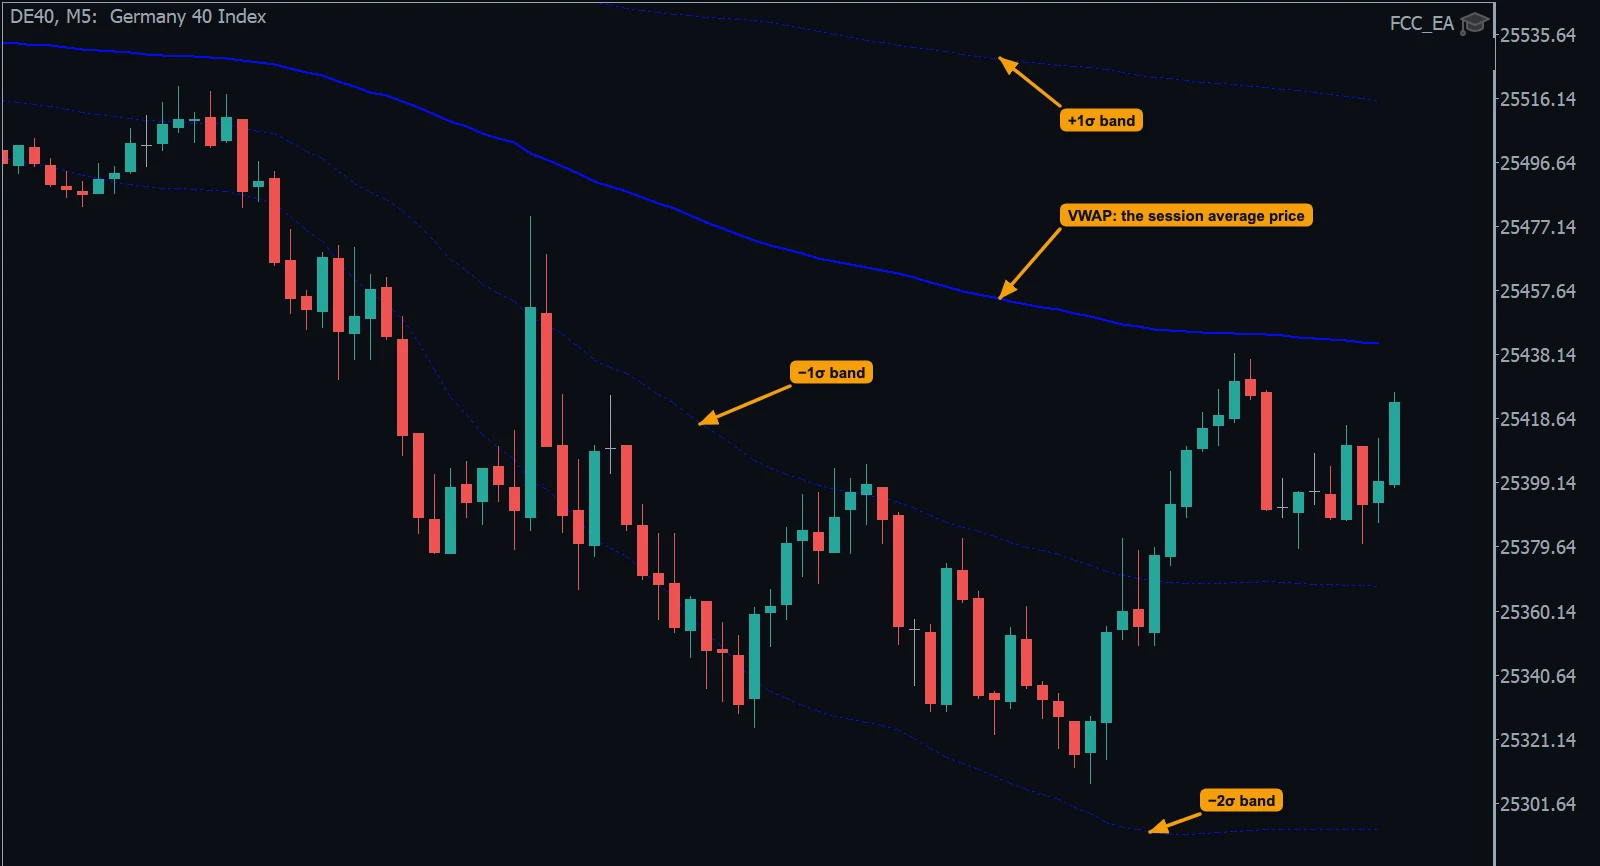
- The VWAP line: the average price of the session, weighted by activity.
- +1σ band: one standard deviation above the VWAP.
- −1σ band: one standard deviation below it.
- −2σ band: two standard deviations below; a deeper, rarer level.
Use case: FCC_EA for VWAP traders — the session VWAP, its bands and the four triggers on one page.
All settings for this feature VWAP Signals settings → Reclaim settings → FVG / IFVG settings → Filters settings →
Backtest this setup free in the Strategy Tester, and adjust it whenever the market changes; every feature is in every plan. Backtest results depend on your broker's data and don't guarantee future results.
Check the FAQ or write to us. We reply within one business day.