Breakeven and trailing stop
Available in FCC_EA Trading Panel Pro Trading Panel Free (basic)
Trading Panel Free: breakeven in full, the trailing stop in points only (no SMMA bands).
Both tools move the stop loss of an open trade in your favour. They never move it back.
Breakeven
Once price has moved Breakeven Distance beyond the entry, the stop is moved to the entry price. From then on the trade cannot turn into a loss (except for gaps and slippage).
Example, BUY at 1.10000 on a 5-digit symbol, Breakeven Distance = 1000: at 1.10100 the stop moves to 1.10000.
The stop goes exactly to the entry price; commission and swap are not added on top.
The same trade as in Stop loss and take profit and Partial close: DE40 M3, SELL 0.1 left after the partial close, Breakeven Distance 6000. 39 minutes after the entry price reached that distance.
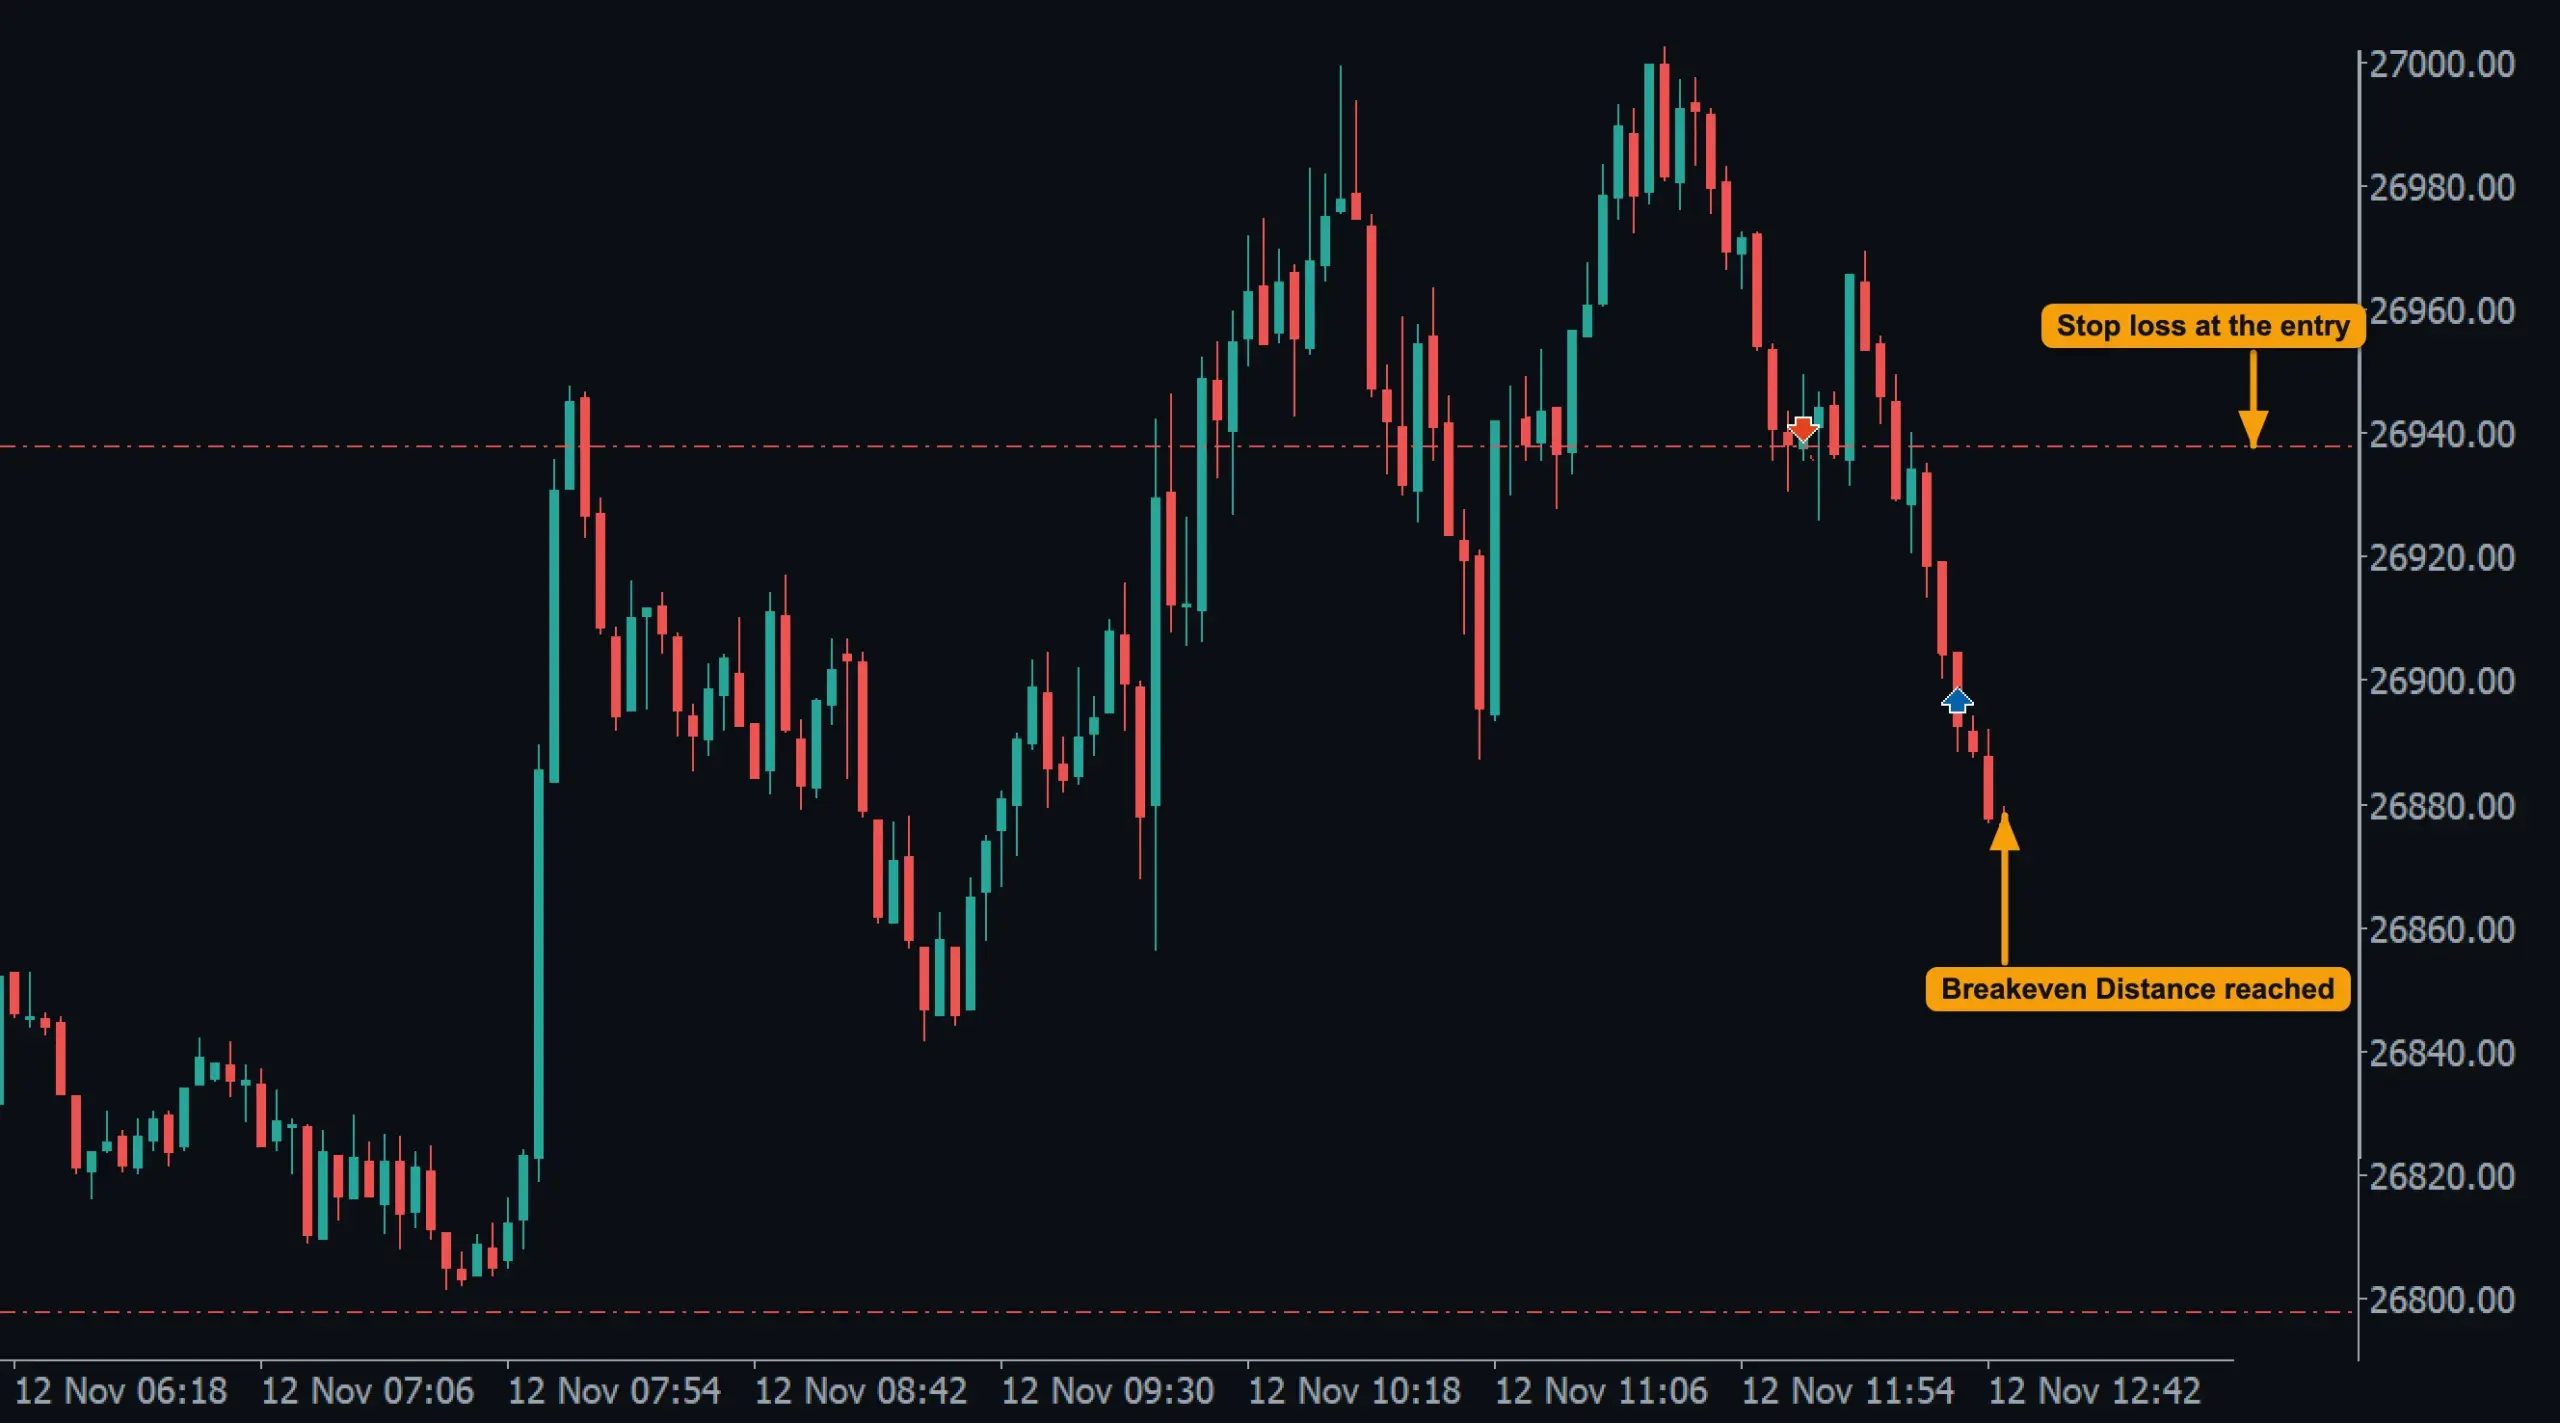
- Breakeven Distance reached: price is 6000 points below the entry.
- Stop loss at the entry: it came down from above to the entry price itself. On a BUY it comes up from below.
Trailing stop
Trailing starts when the trade is Trailing Start points in profit and then follows price.
By points
The stop is kept Trailing Distance points behind the current price and moved forward in steps of at least Trailing Step points.
Example, BUY at 1.10000, start 1000, distance 500, step 50:
| Price | Stop |
|---|---|
| 1.10900 | not started yet |
| 1.11000 | 1.10500 |
| 1.11030 | 1.10500 (moved less than the step) |
| 1.11060 | 1.10560 |
| 1.10800 | 1.10560 (never moves back) |
If the distance is larger than the start, the first trailing stop is still behind the entry, so the trade can still close at a small loss. Use breakeven together with trailing, or keep the distance at or below the start.
On a real trade
The same SELL, Trailing Start 8000, Trailing Distance 3000. 49 minutes after the entry the trade was 8000 points in profit and trailing started.
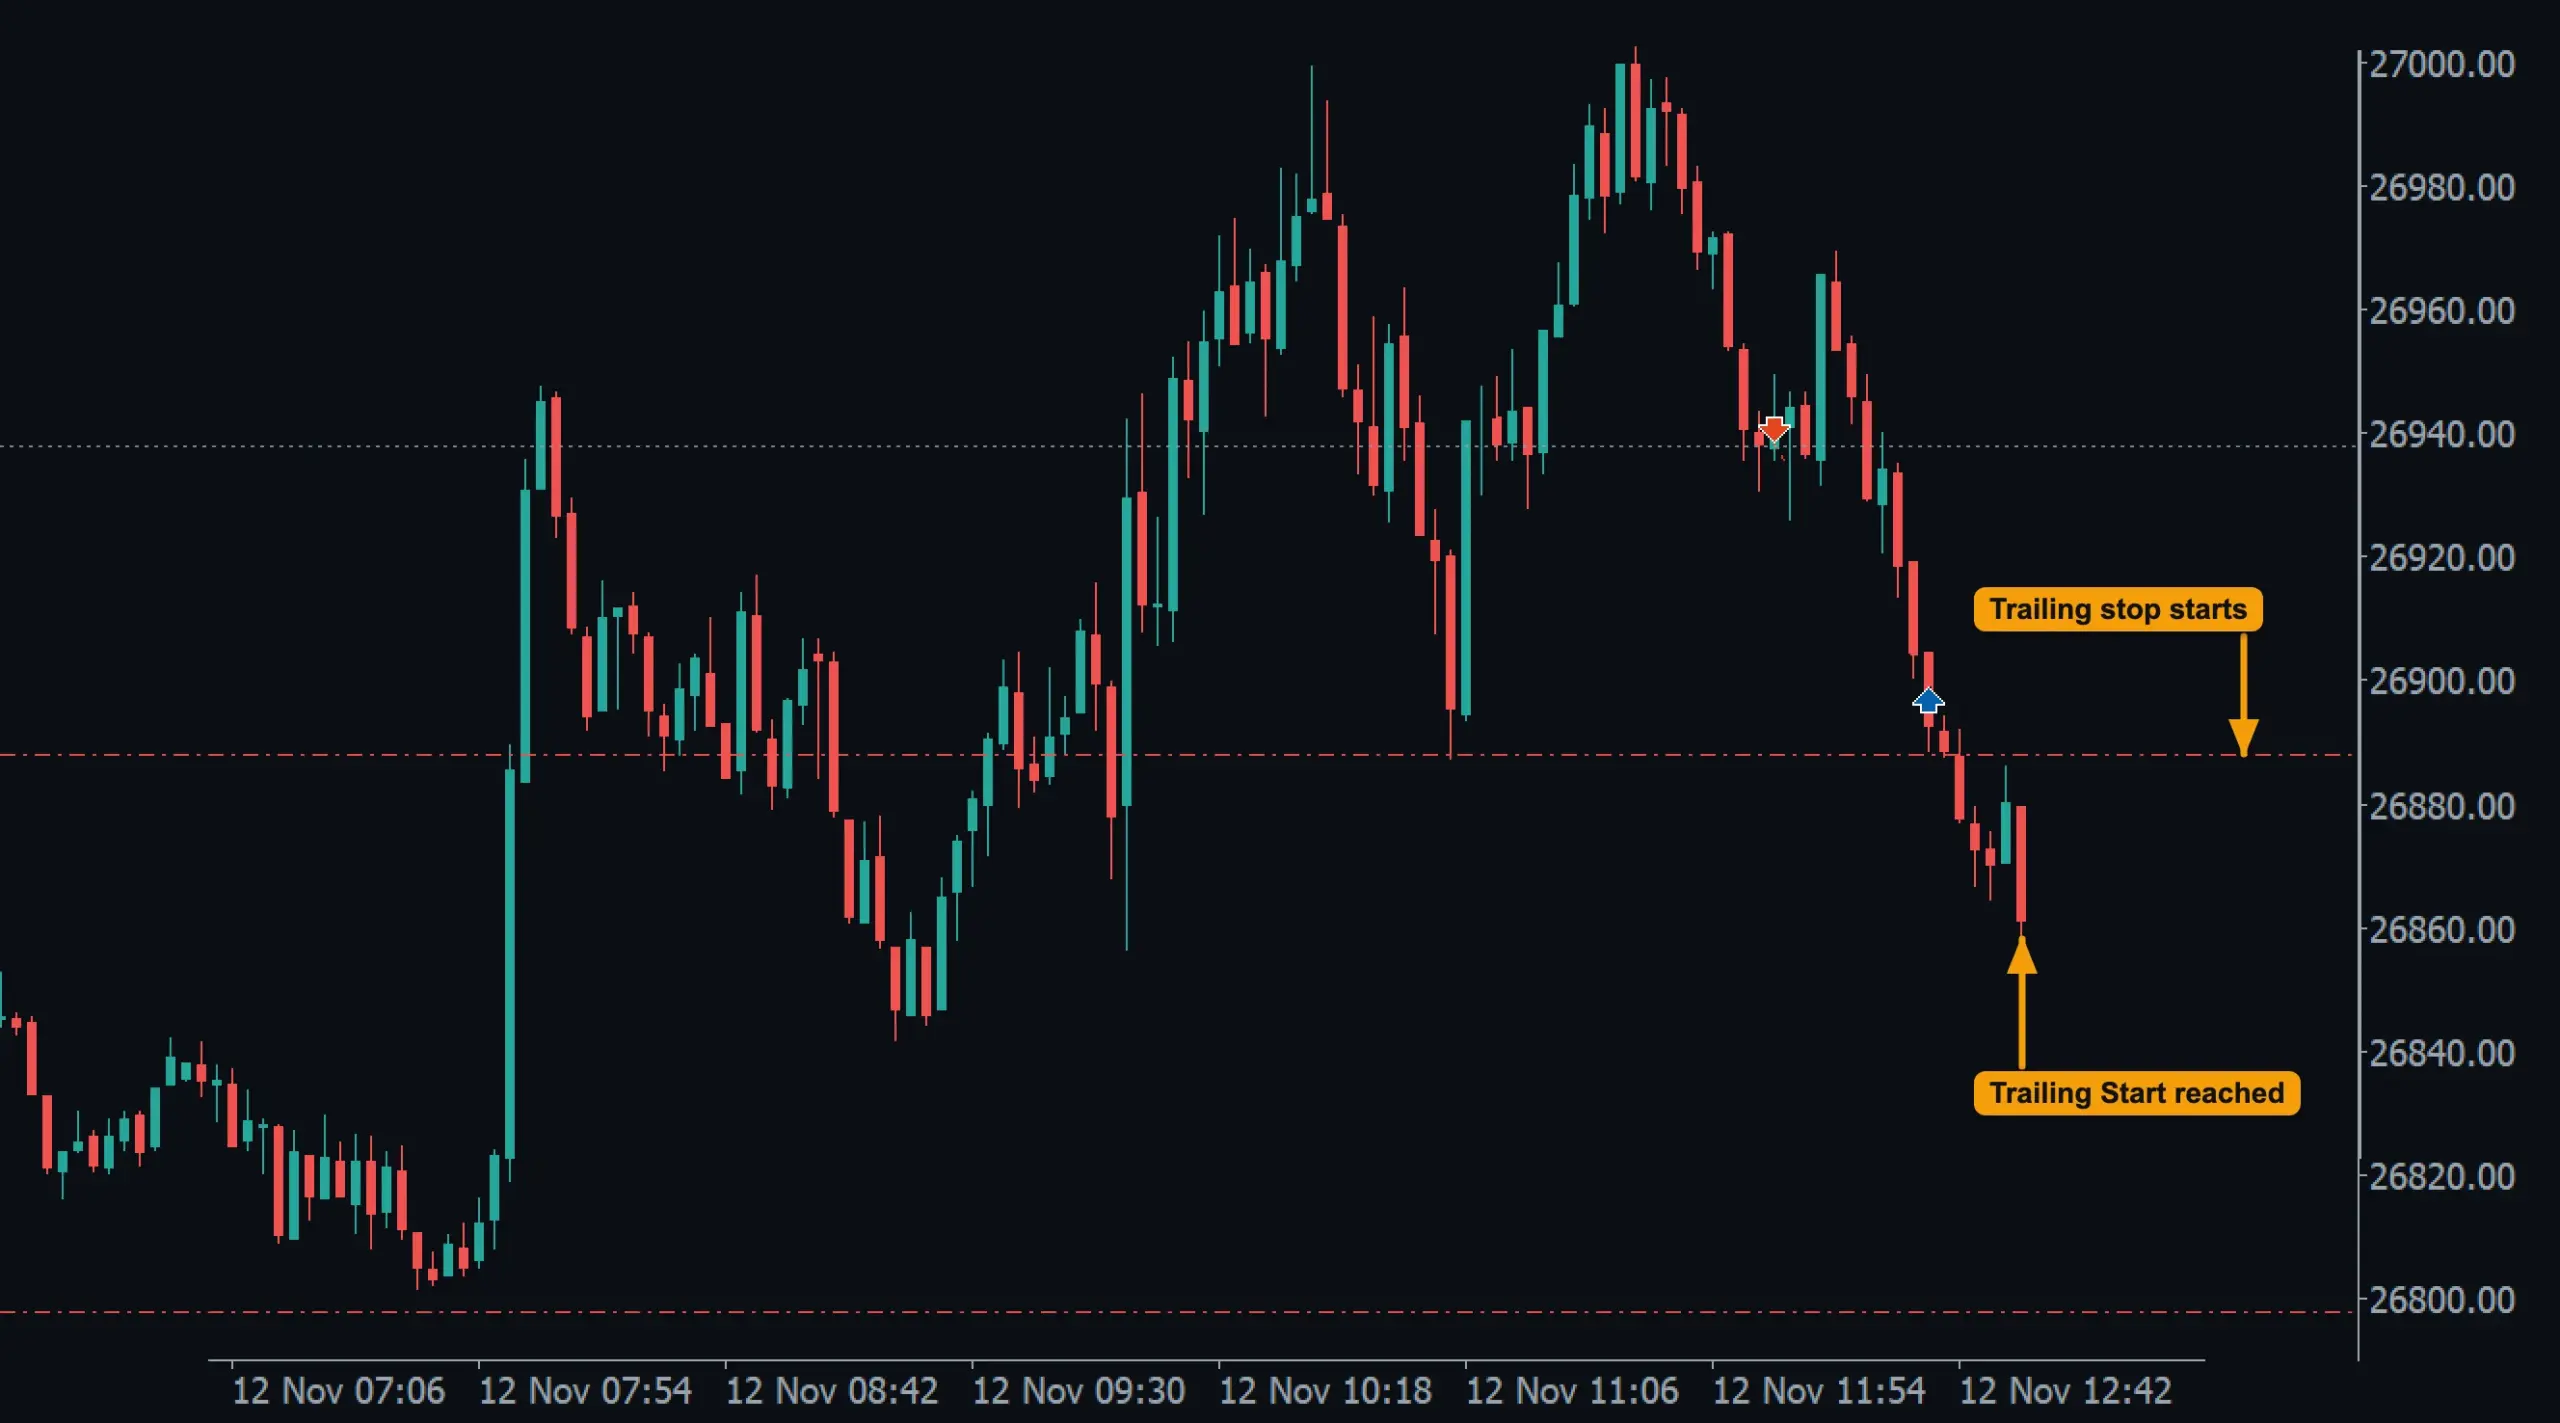
- Trailing Start reached: price is 8000 points below the entry.
- Trailing stop starts: the stop moved from the entry to 3000 points above the current price, so this part of the trade is now locked in profit.
As price kept falling, the stop followed it within the same minute.
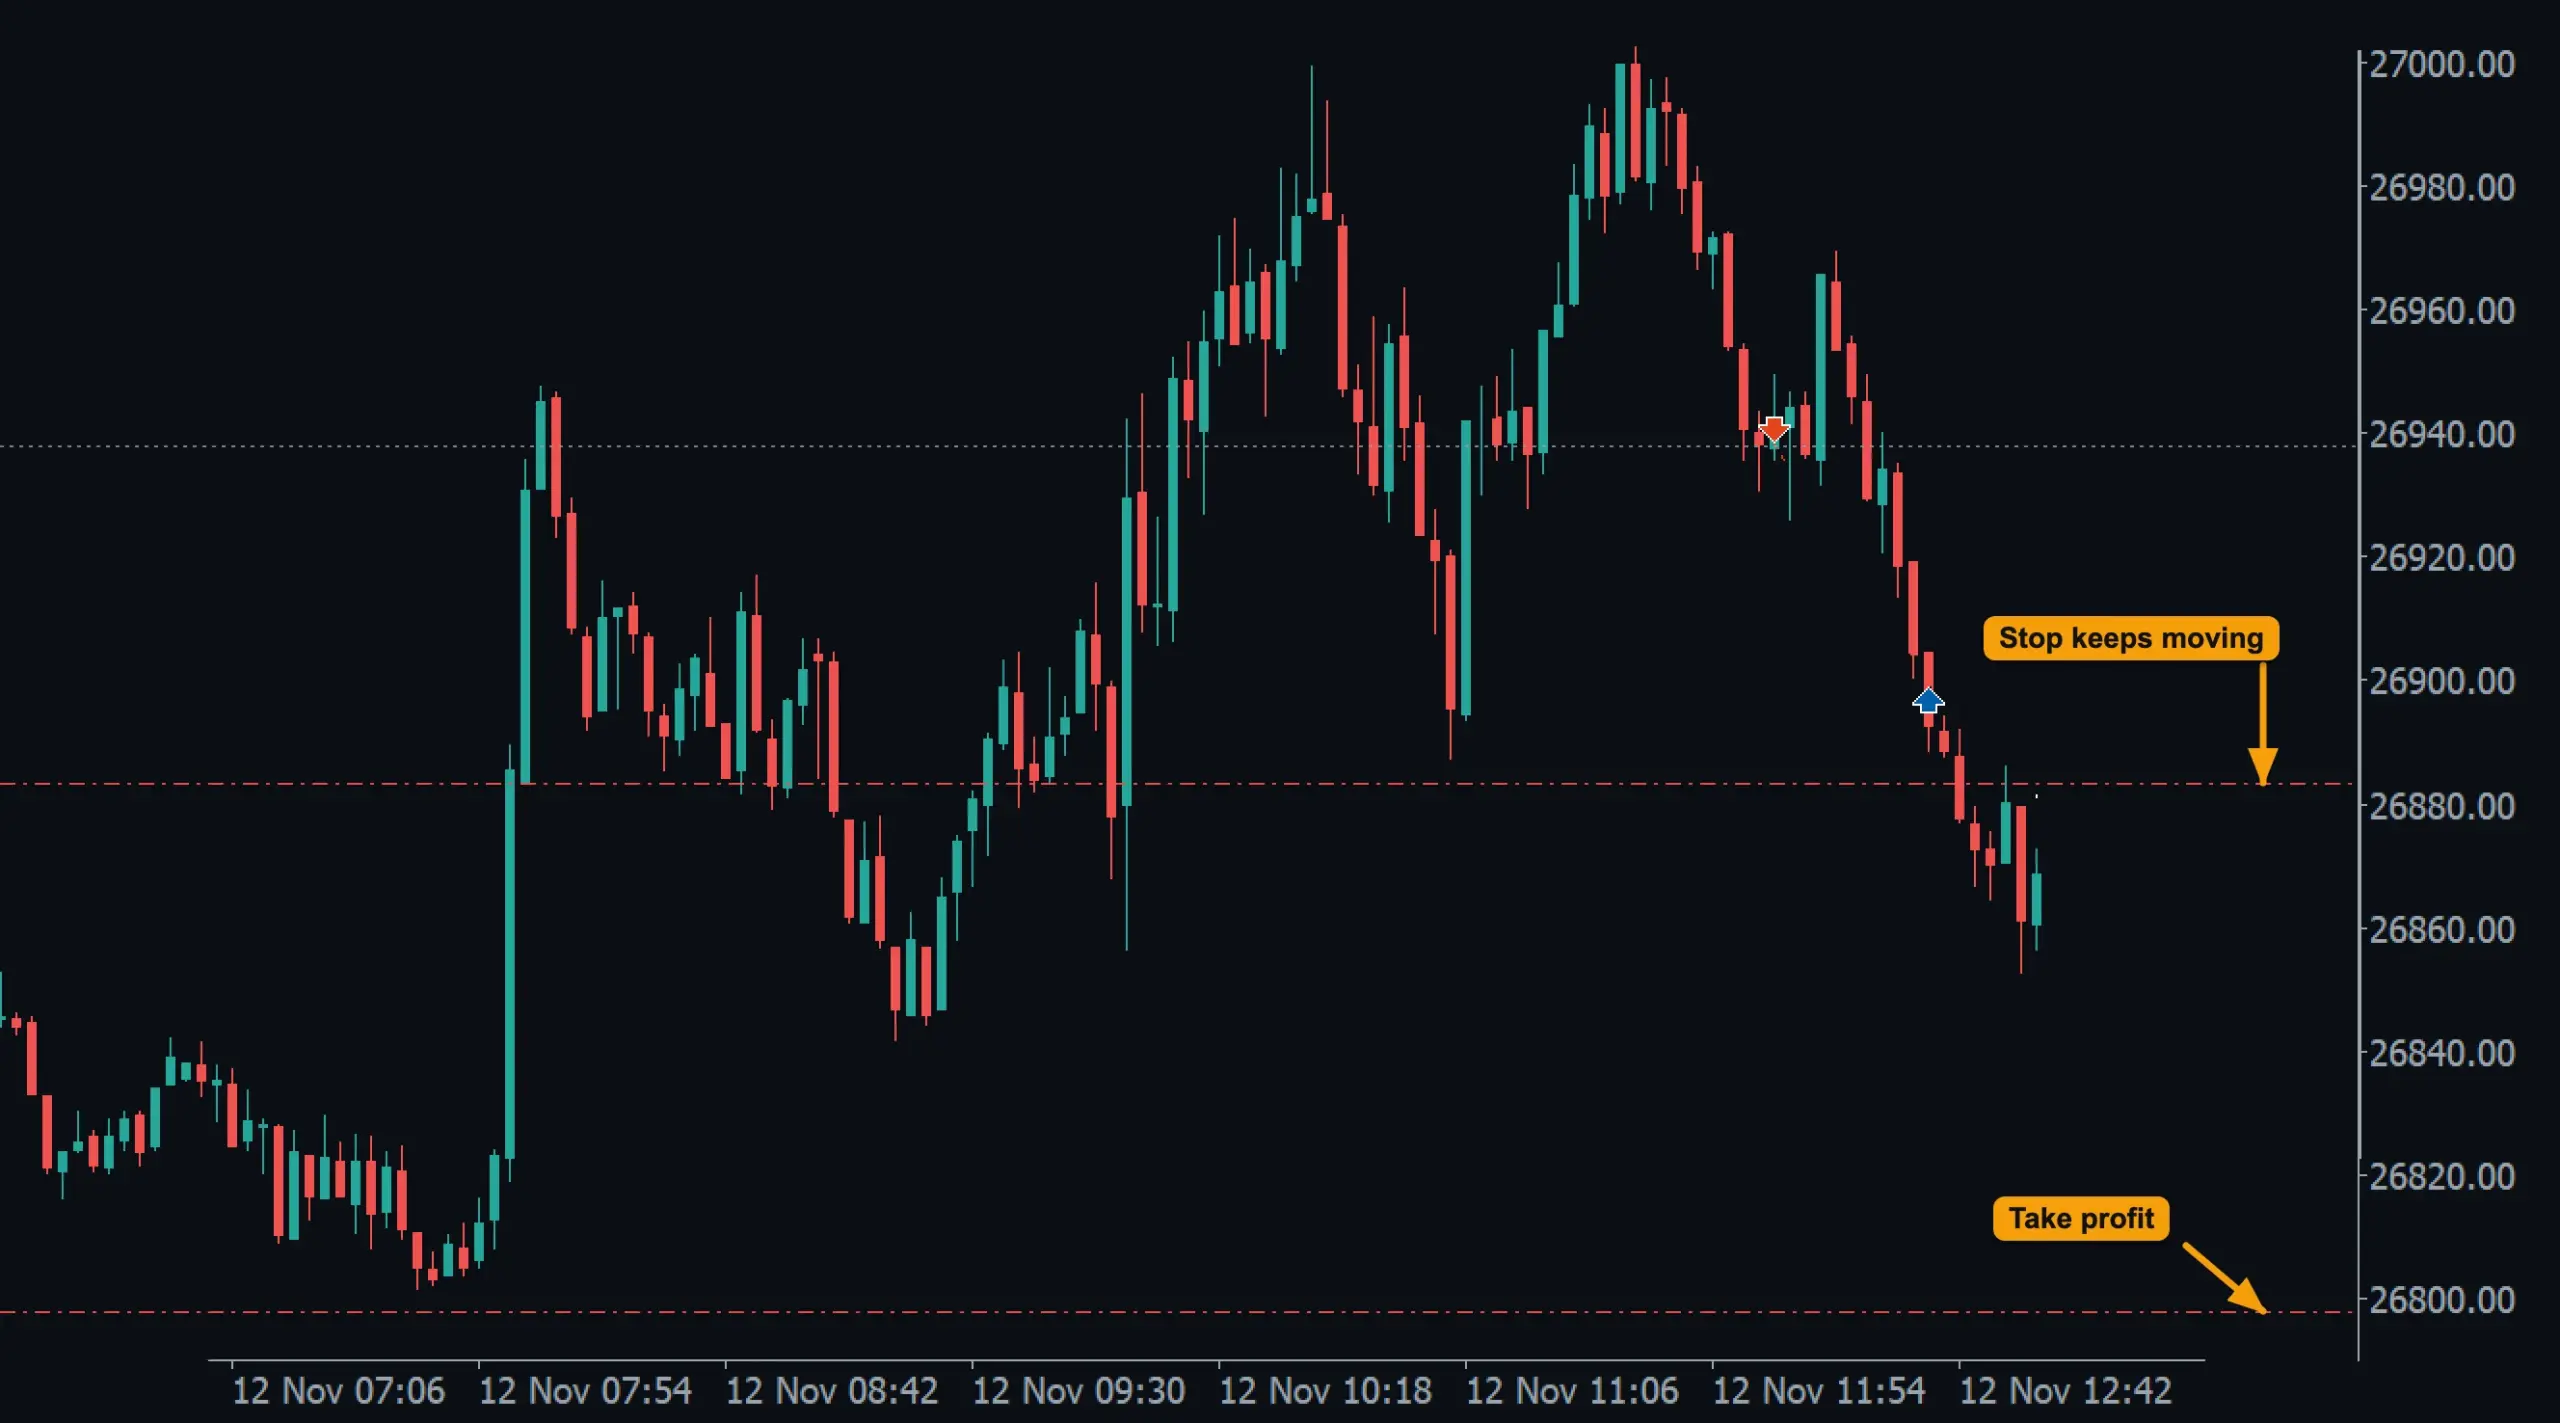
- Stop keeps moving: it stays Trailing Distance behind price.
- Take profit: not reached yet, still working.
Price then turned up, hit the stop and closed the trade before the take profit. The stop never moved back.
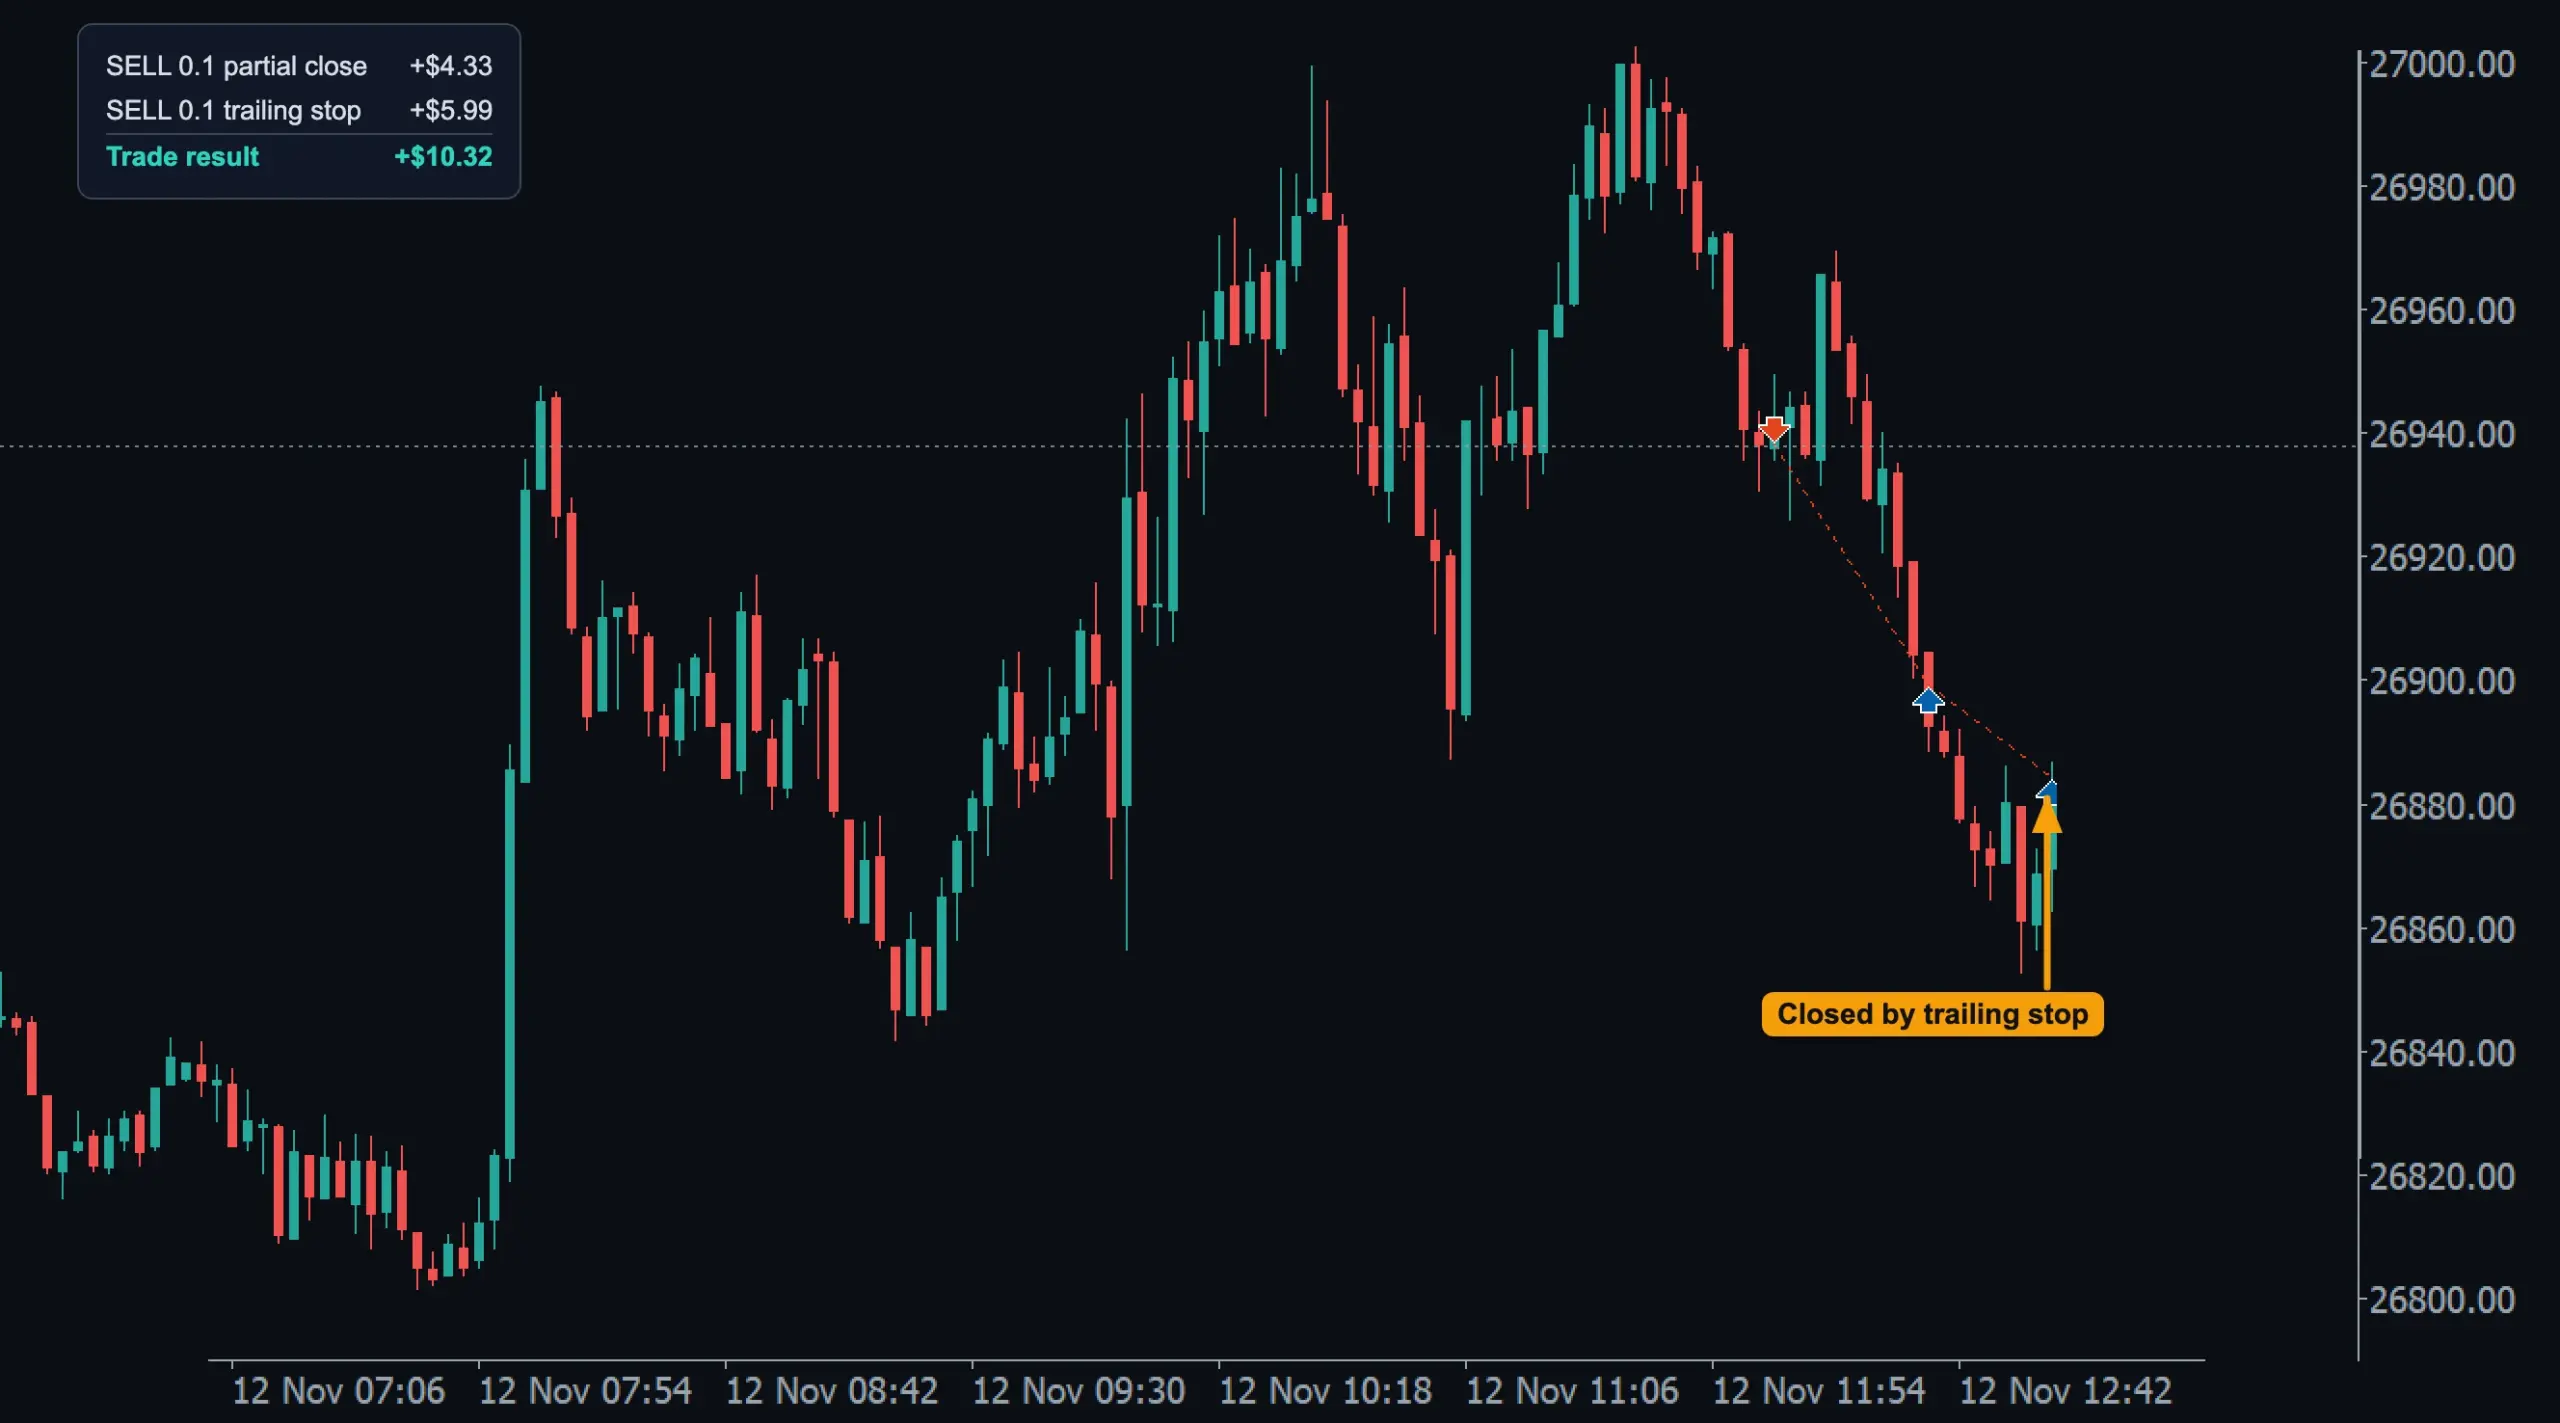
- Closed by trailing stop: the rest of the position, SELL 0.1, closed at the last stop level.
- Result: partial close +$4.33, trailing stop +$5.99, trade +$10.32.
Along an SMMA band
With Trailing Method = SMMA Bands the stop sits just beyond a moving band instead of a fixed distance: below the band's low line for a BUY, above its high line for a SELL, plus Trailing Offset points of room. Fast follows the fast SMMA band (tighter), Slow the slow band (wider); SMMA Band Timeframe chooses the timeframe of the band. The stop follows the band as it rises (for a BUY) and stays put when it falls.
A real trade on DE40 M1 (4 November 2026, demo account): a BUY 0.1 from a signal, with SMMA Band Type = Fast, SMMA Band Timeframe = M1, Trailing Offset 300, Trailing Start 1500, Stop Loss 4000 and Take Profit 12000. The band is drawn with Display Fast SMMA (L/H)?.
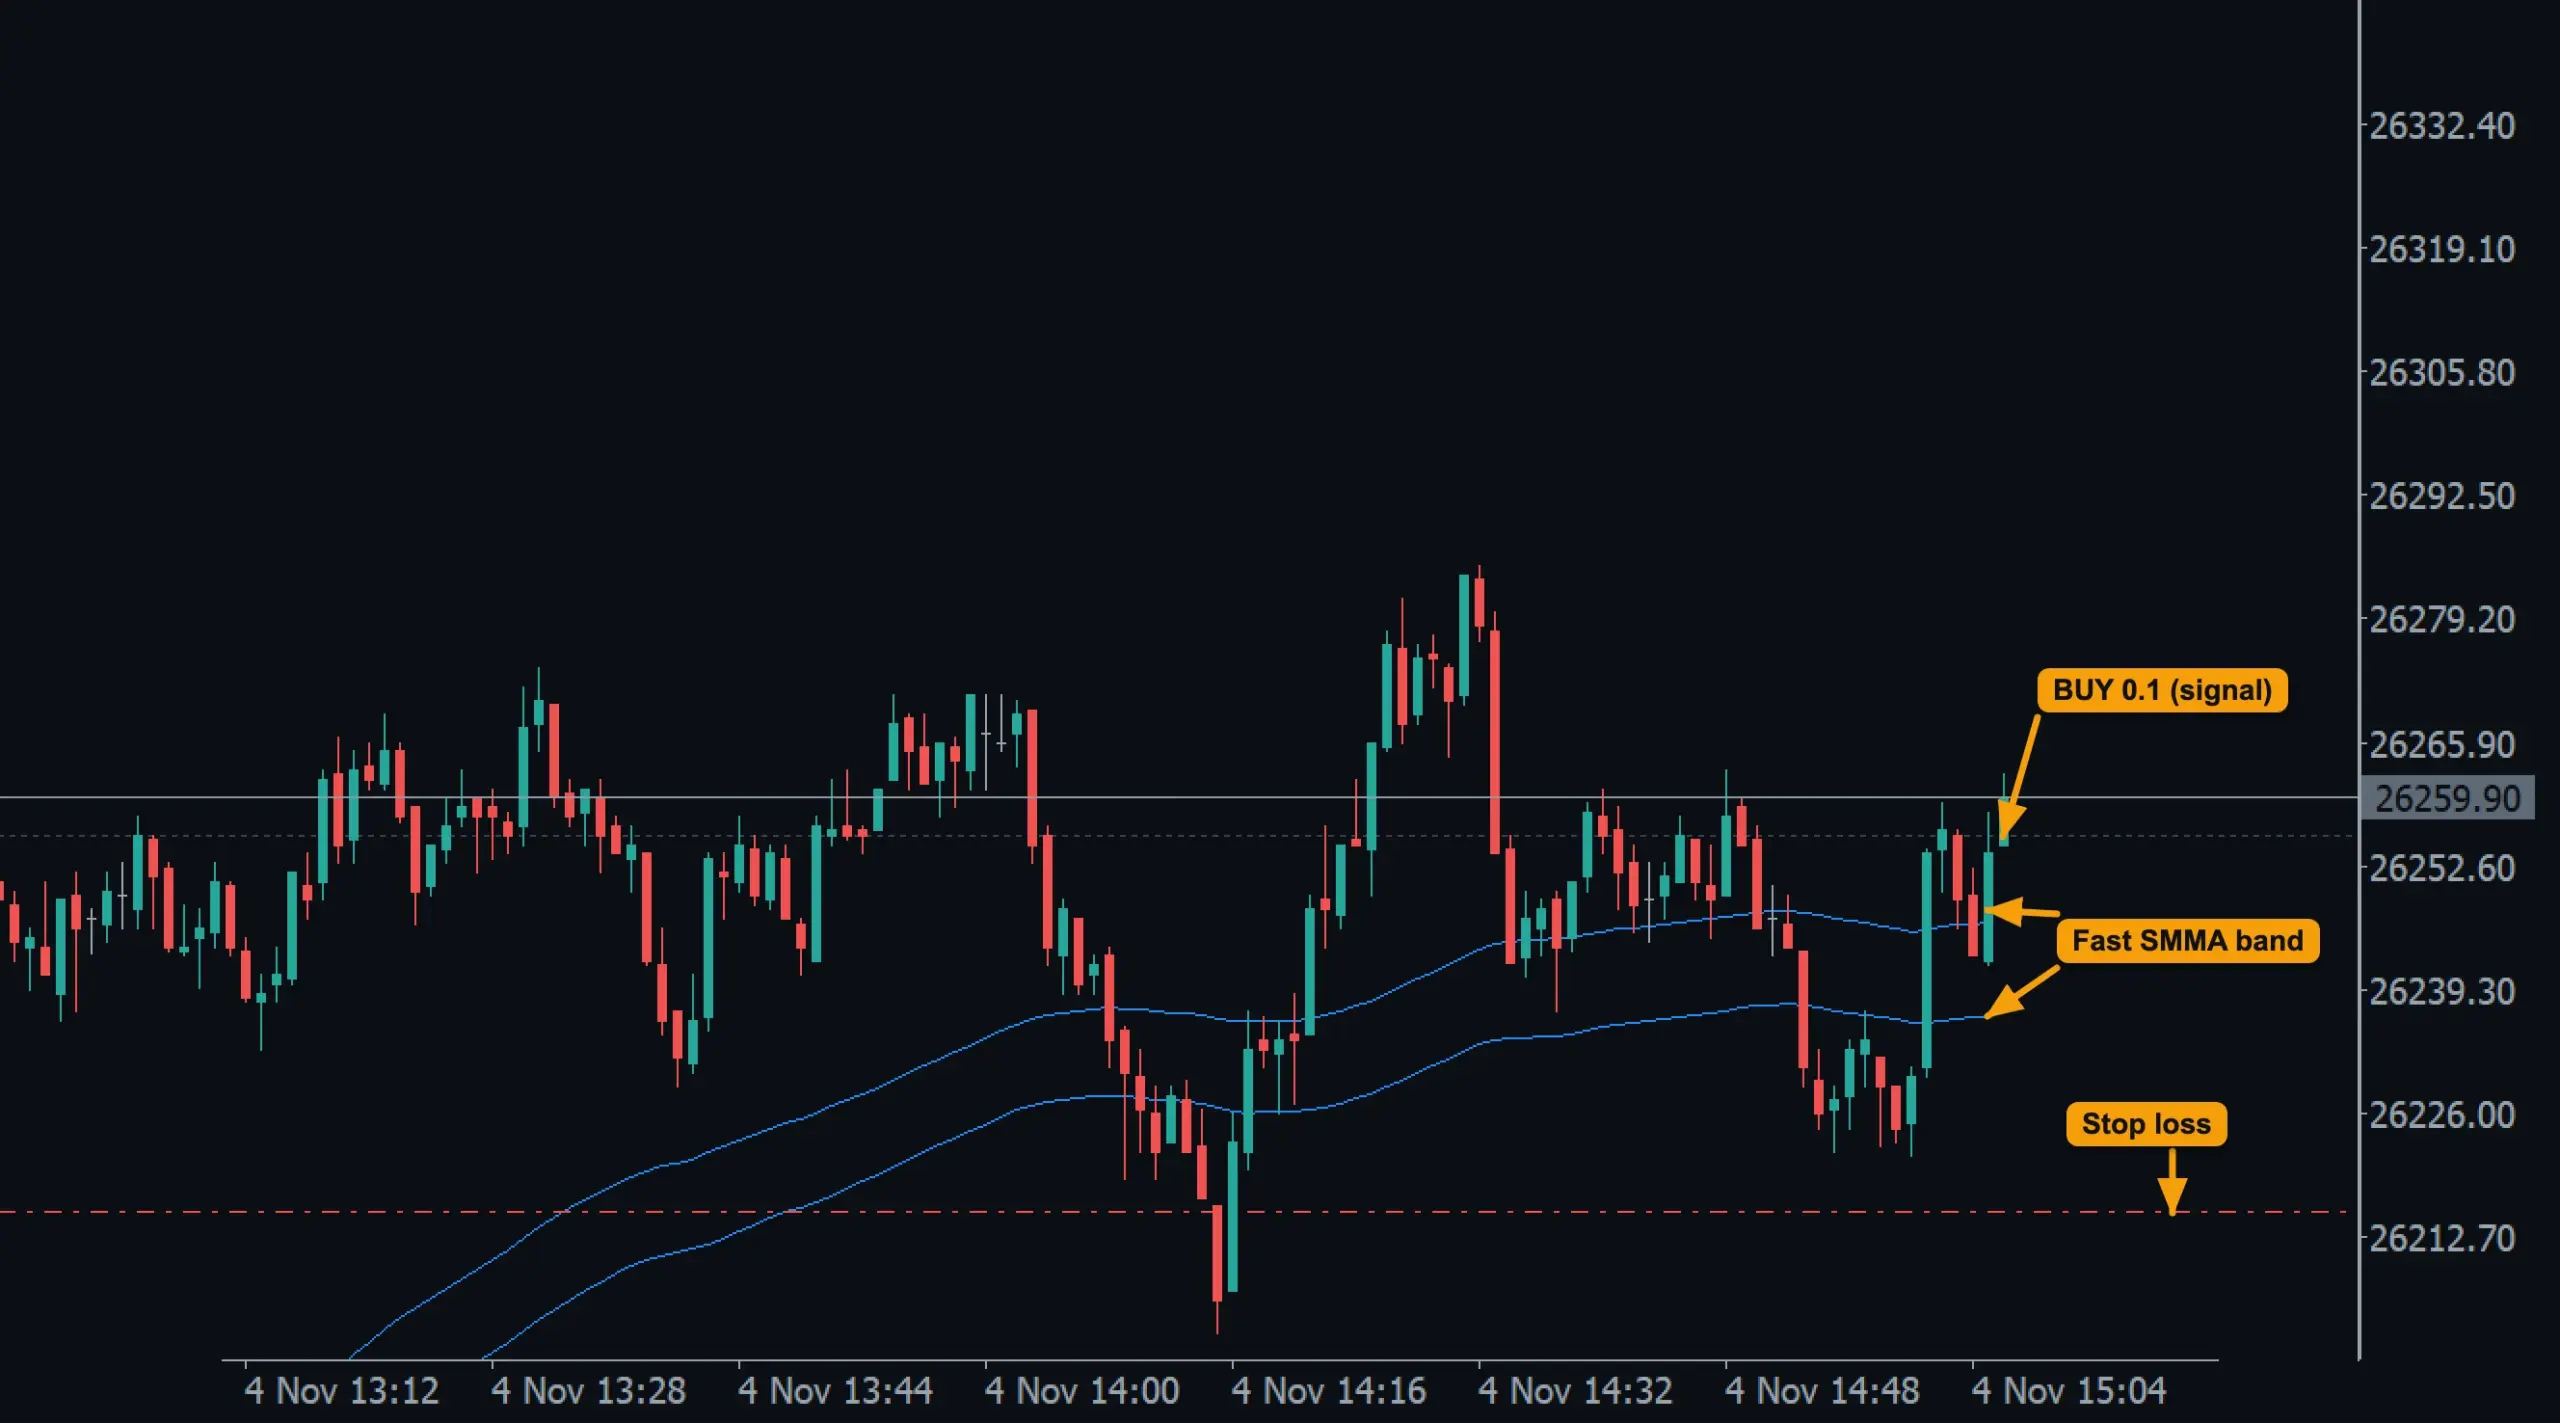
- BUY 0.1 from a signal.
- Fast SMMA band: its high line and its low line.
- Stop loss: still at the Stop Loss distance from the entry. Trailing has not started.
Ten minutes later the trade was Trailing Start points in profit, and the stop jumped up to the band.
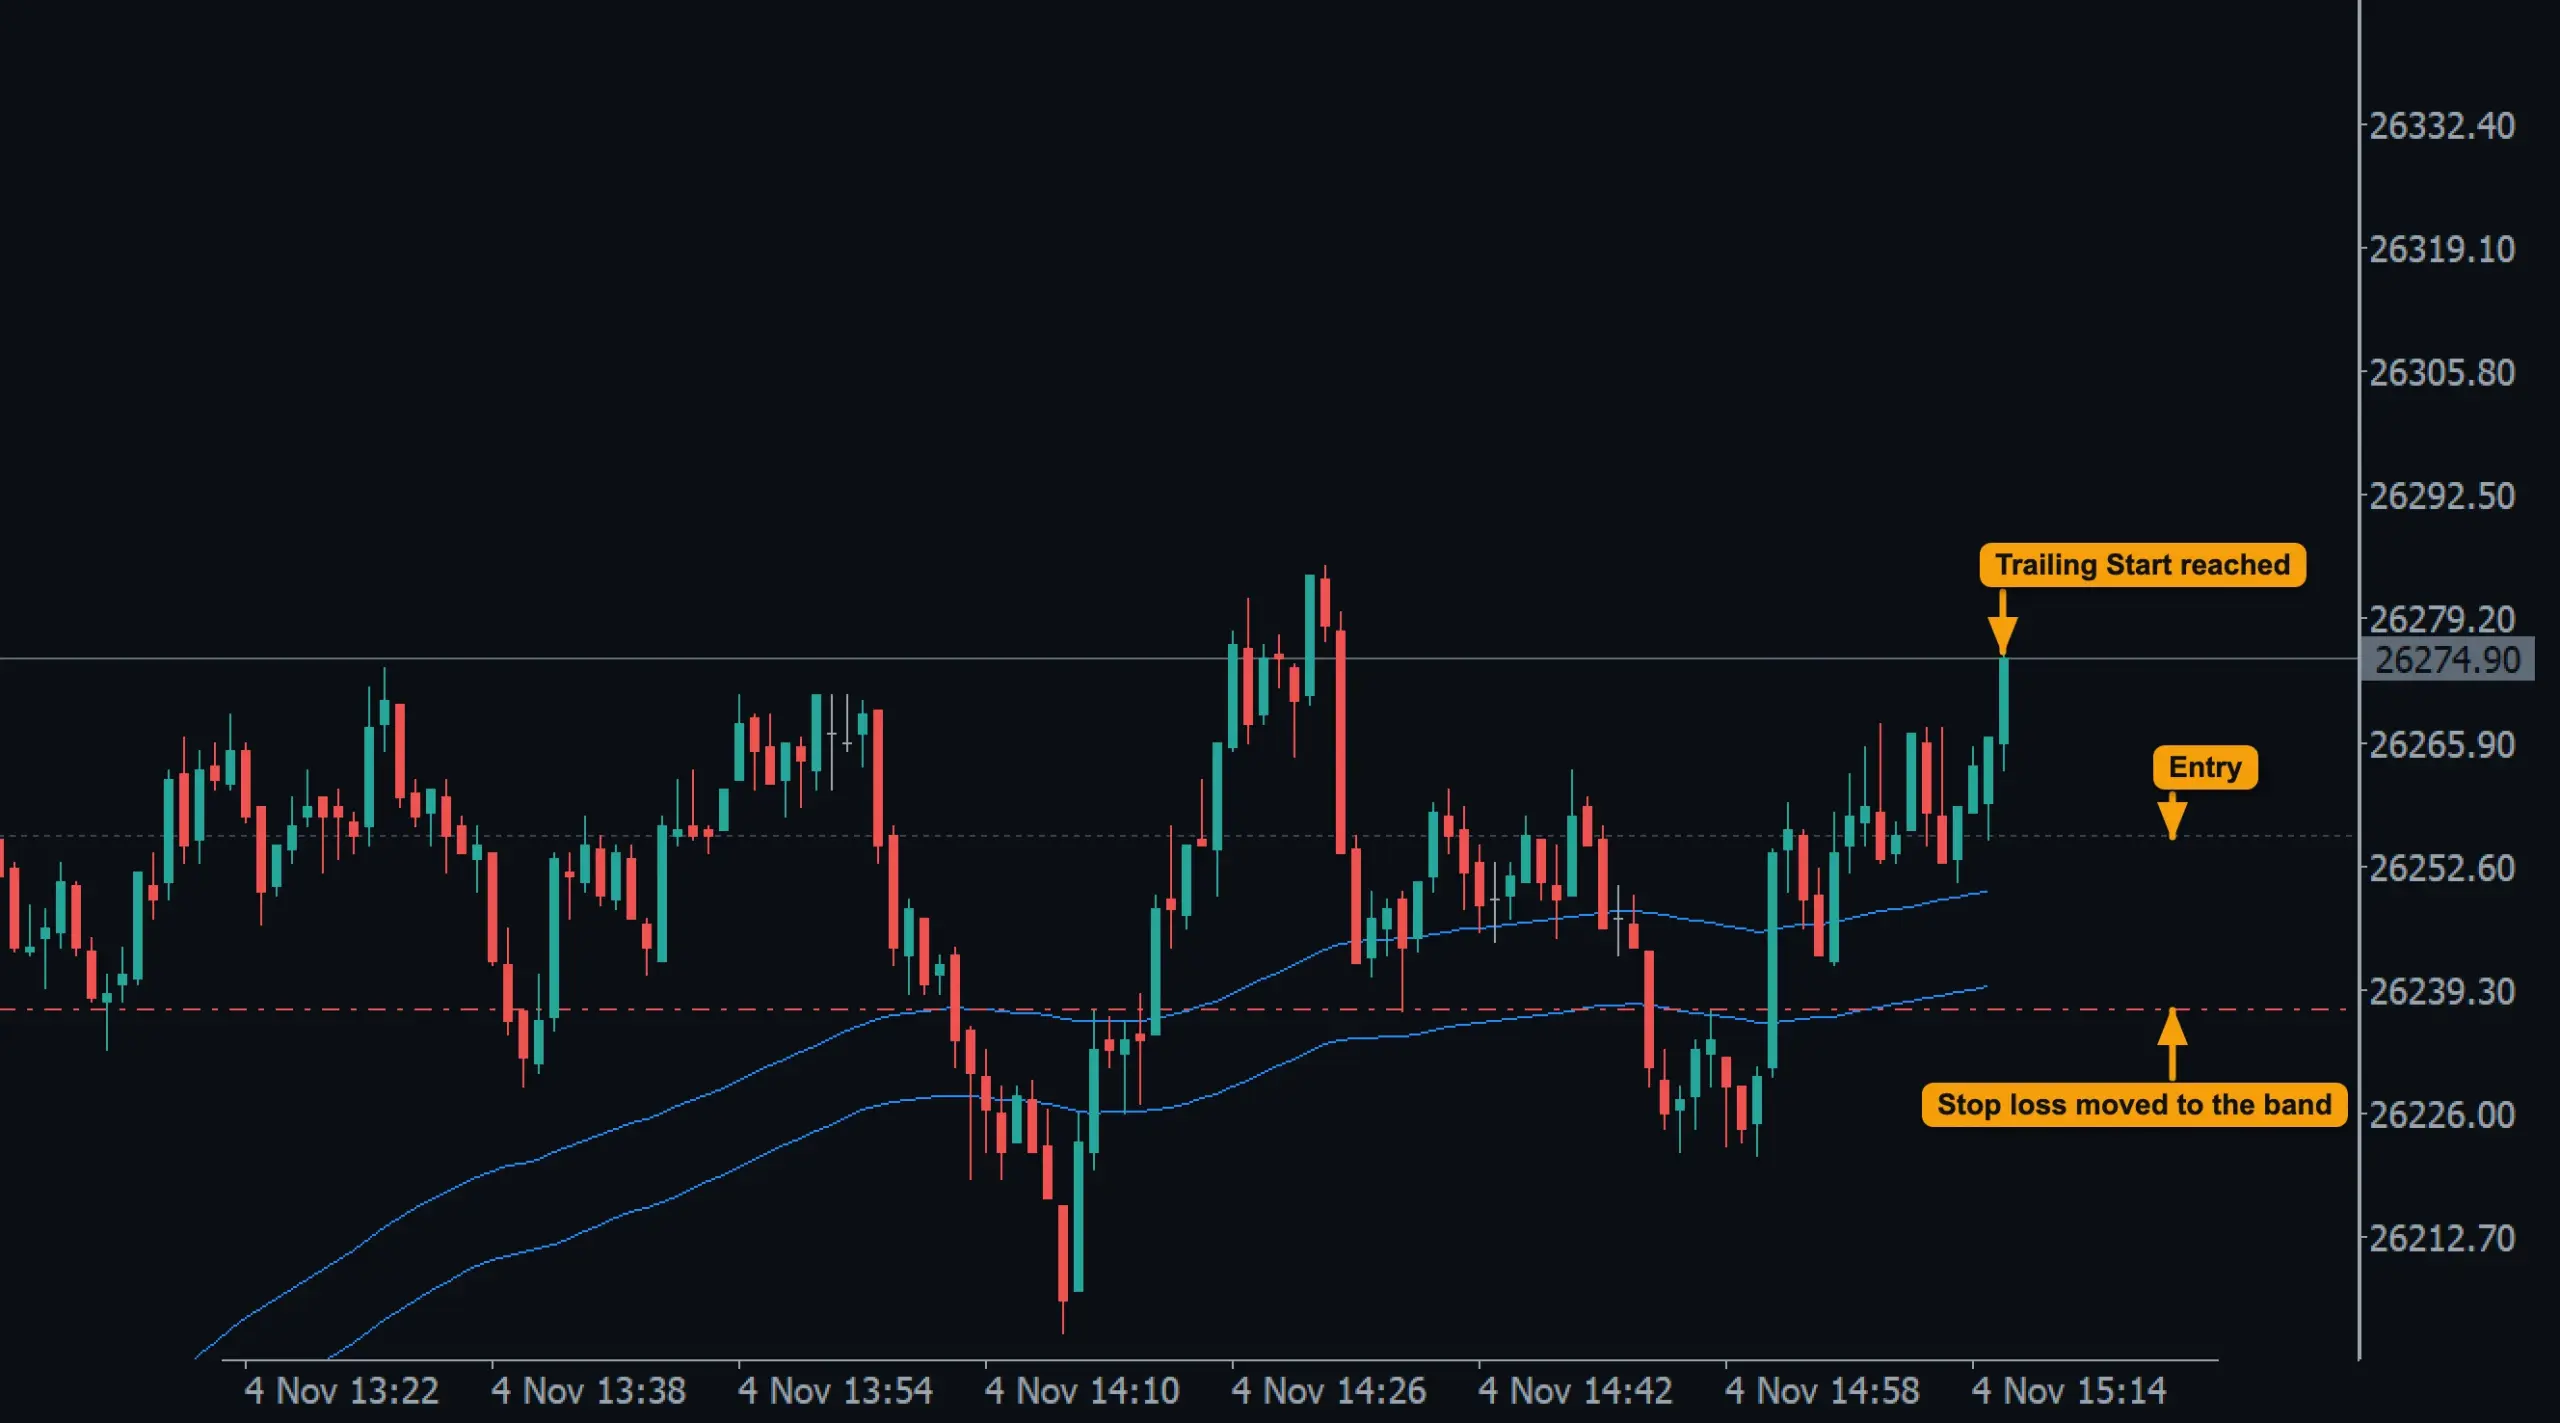
- Trailing Start reached: price has passed 1500 points above the entry.
- Stop loss moved to the band: Trailing Offset (300 points) below the band's low line. It is still below the entry.
- Entry: the price of the BUY.
From then on the stop rose with the band, candle by candle. 28 minutes after the entry it passed the entry price, so the trade could no longer close at a loss (except for gaps and slippage).
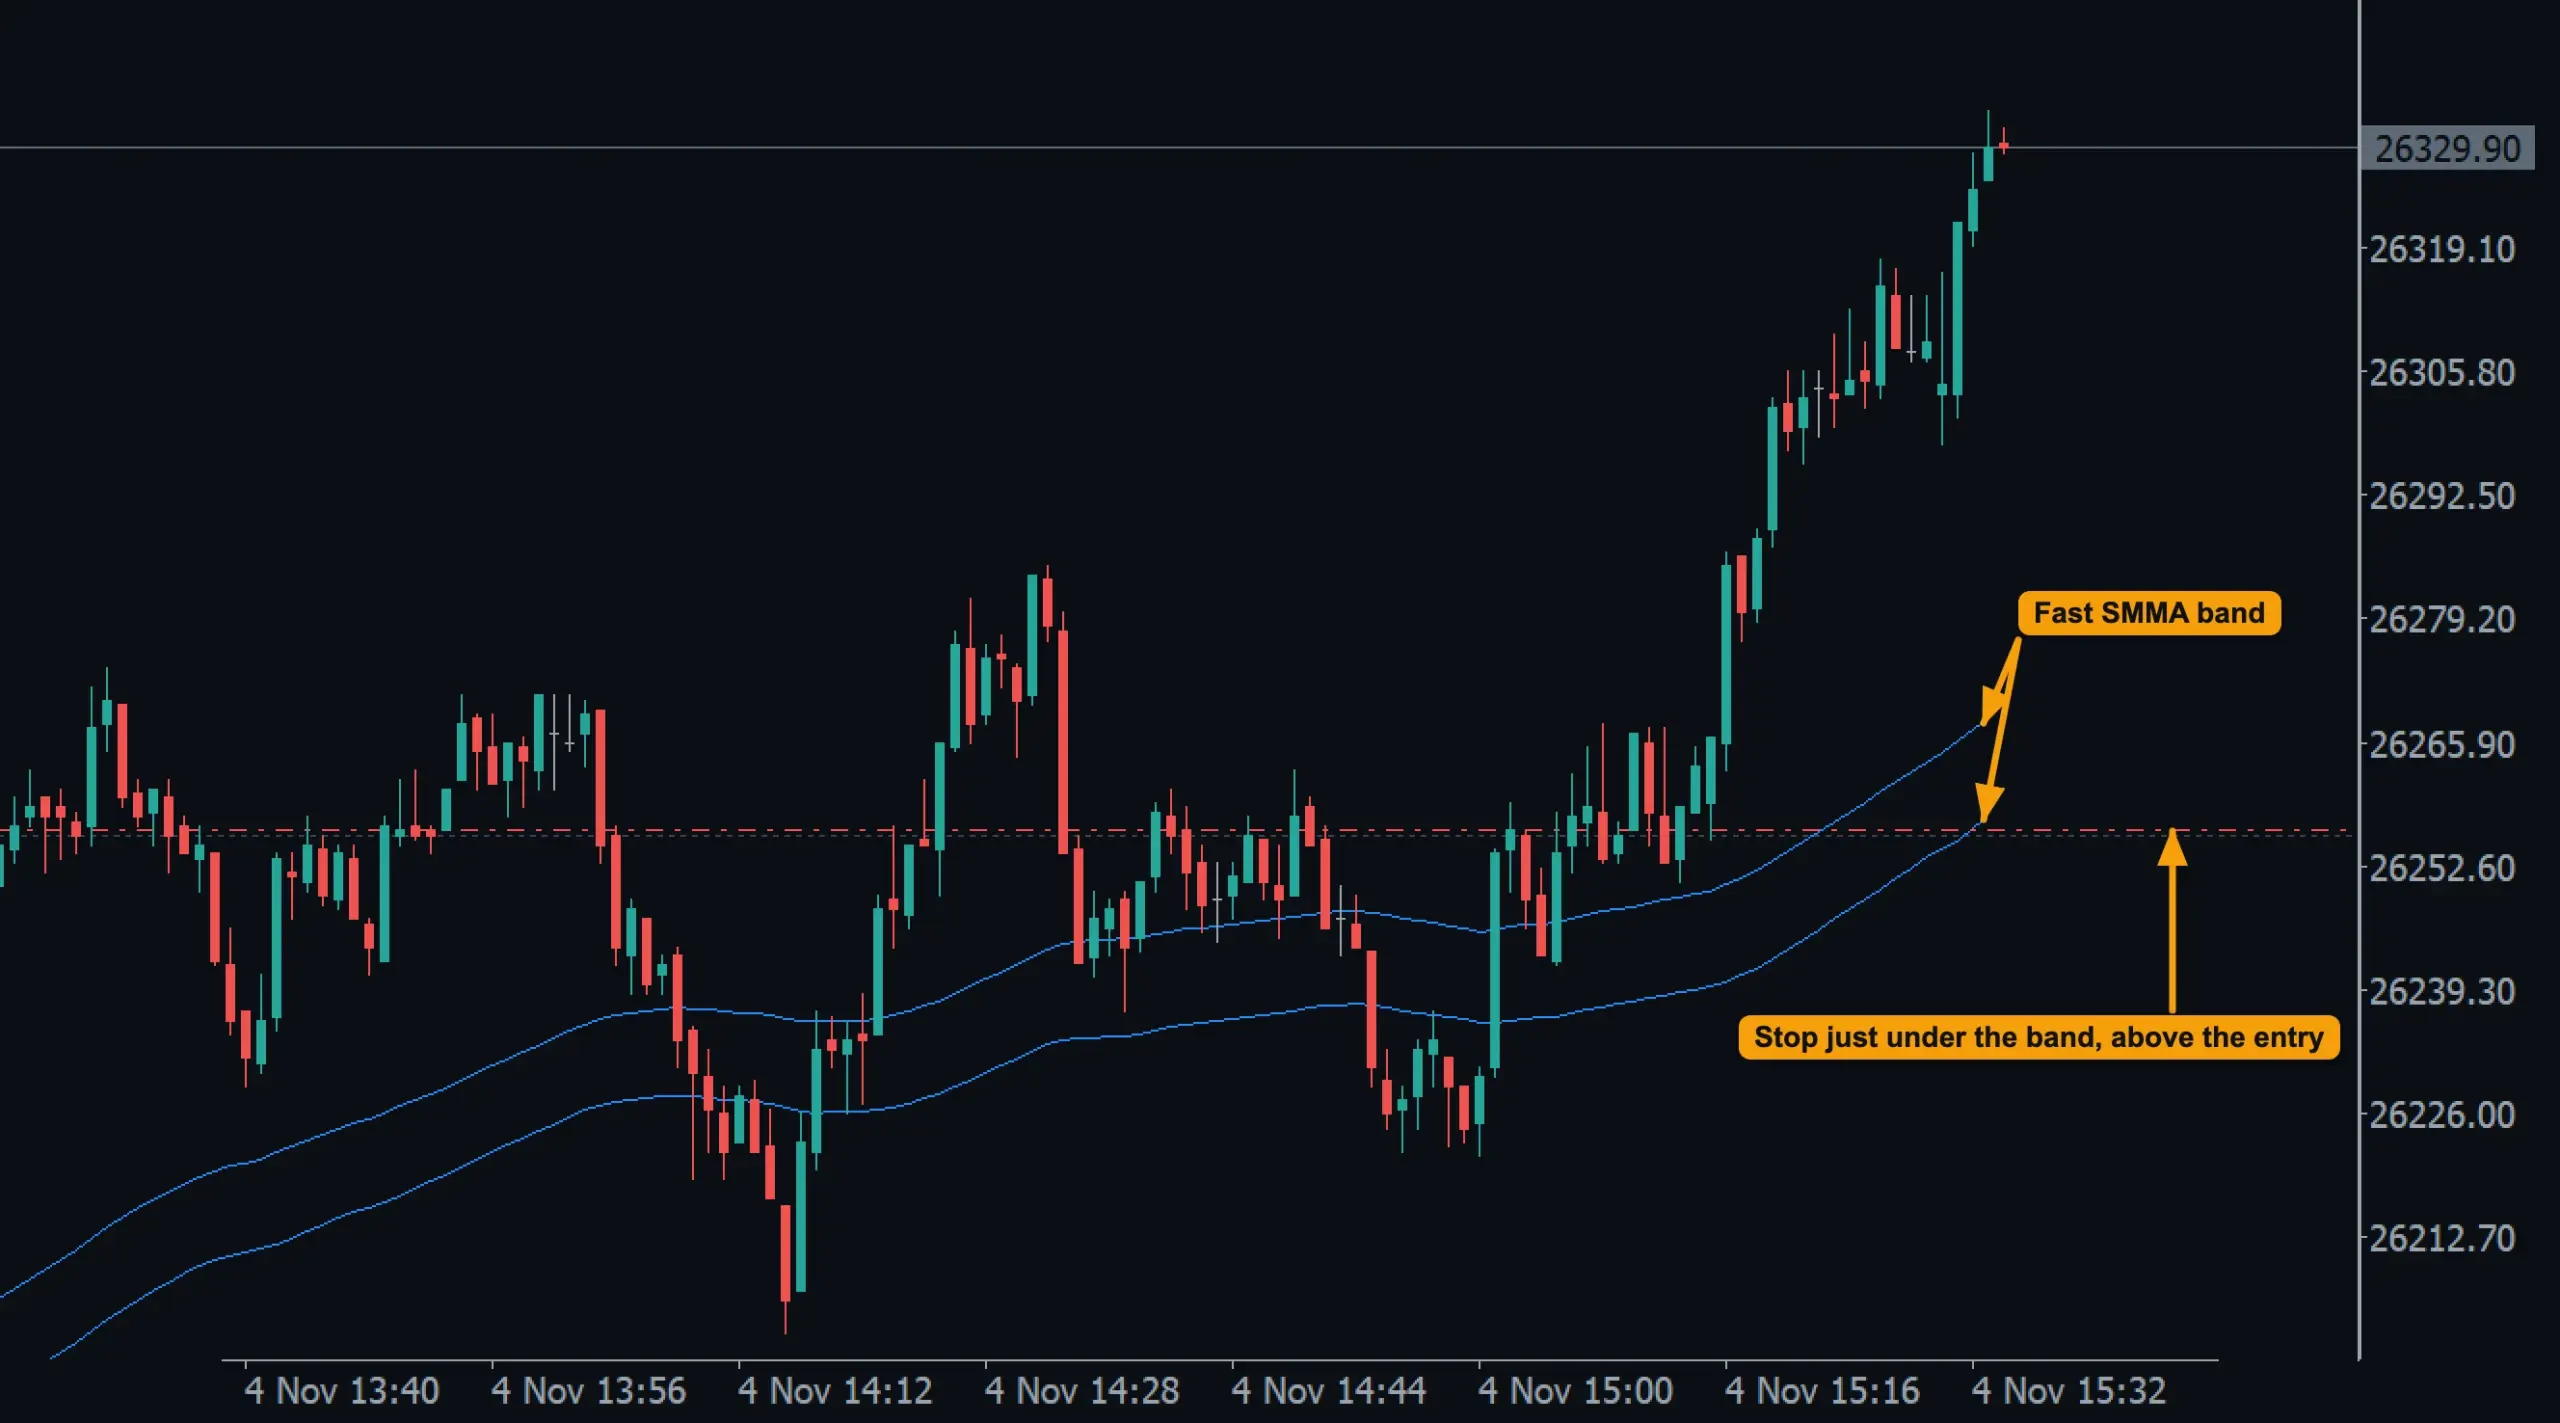
- Fast SMMA band: it rises more slowly than price, so in a strong move the stop stays well behind.
- Stop just under the band, above the entry: the trade is now protected in profit.
Price kept rising and reached the Take Profit before it ever came back to the stop. Had it turned earlier, the trailing stop would have closed the trade.
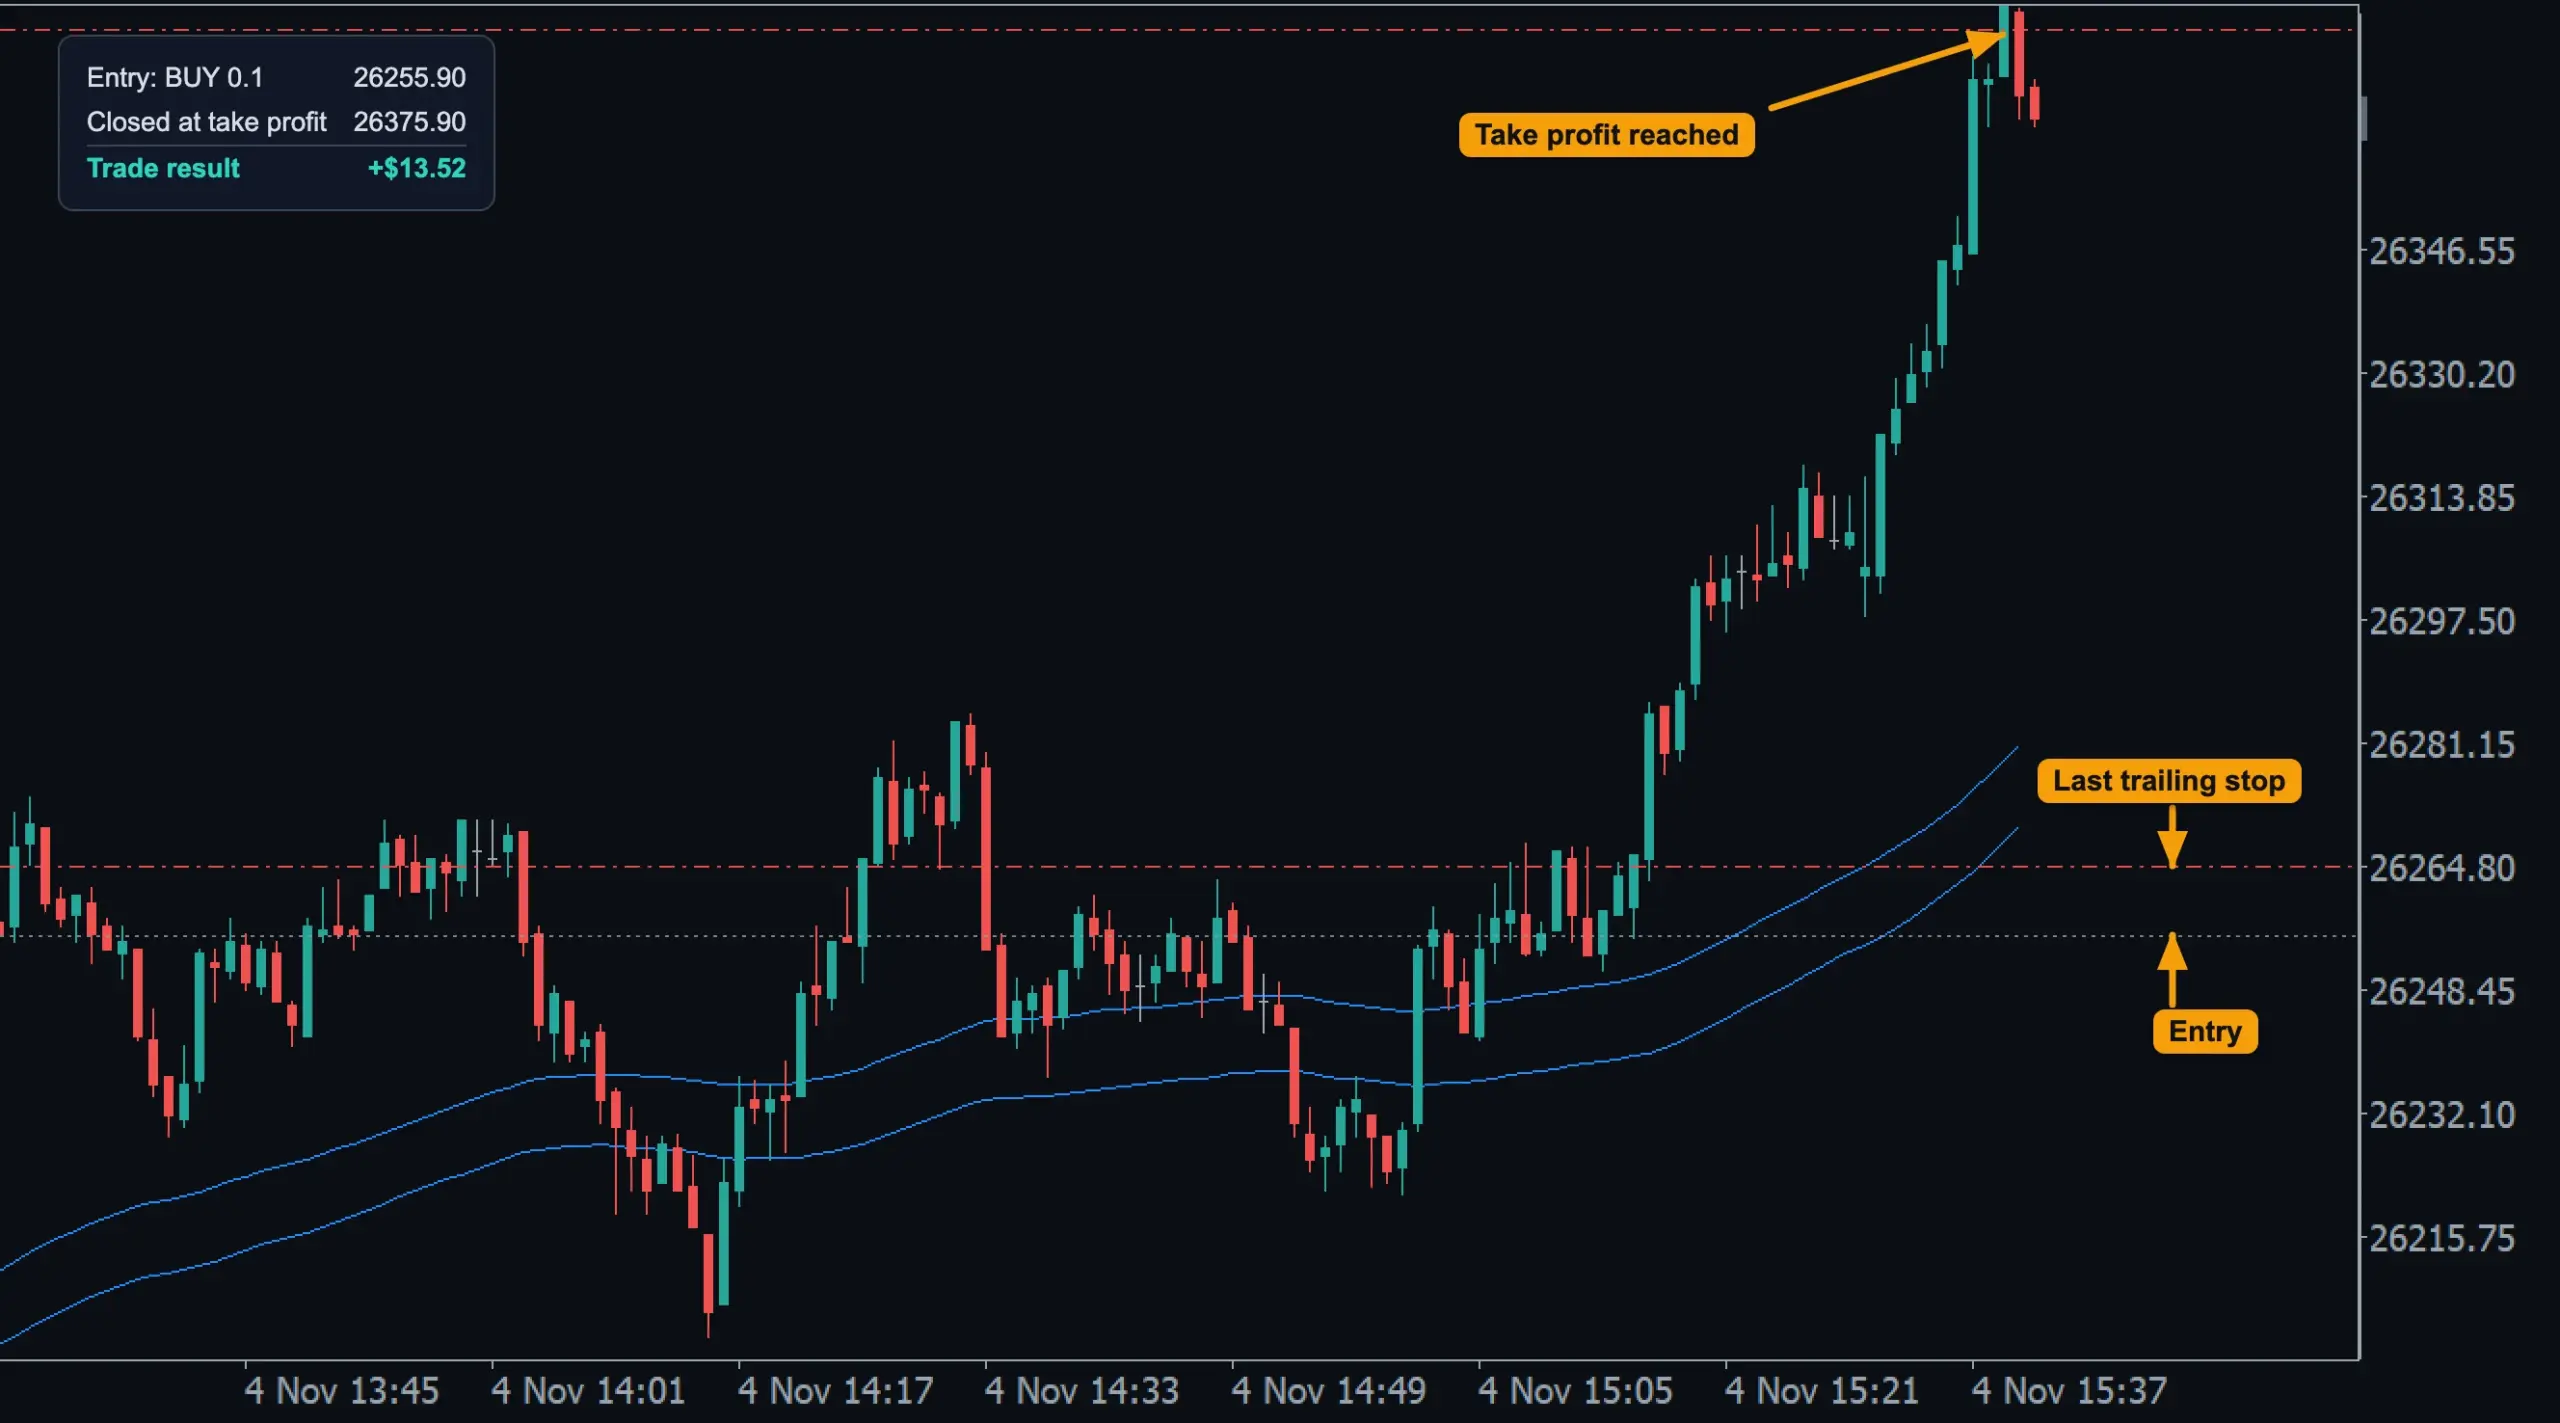
- Take profit reached: the trade closed at 26375.90.
- Last trailing stop: where the stop was when the trade closed, above the entry.
- Entry: the BUY at 26255.90. Trade result: +$13.52.
With several positions
If a slot holds several positions in one direction (grid, pyramid, add-ons), both tools measure the profit from their average entry price, and breakeven moves every stop to that average.
When they do not run
- During an active hedge cycle: the basket has its own exits.
- In Manual trading mode the values of the Trading Panel MANAGEMENT section are used instead of these settings.
- If the broker does not allow a stop that close to the price, the move waits until it can be made.
All settings for this feature Breakeven settings → Trailing settings →
Backtest this setup free in the Strategy Tester, and adjust it whenever the market changes; every feature is in every plan. Backtest results depend on your broker's data and don't guarantee future results.
Check the FAQ or write to us. We reply within one business day.