SMMA Signals method
The SMMA Signals method uses two bands instead of single lines. Each band has two smoothed moving averages (SMMA): one of the candle highs and one of the candle lows, so the band has a width that follows volatility.
- Fast band (Fast SMMA Period): follows price closely.
- Slow band (Slow SMMA Period): the bigger trend.
Price above a band = buyers in control on that time scale; below it = sellers.
Triggers
Band Breakout
Price breaks out of a band and stays out for two candles:
- BUY: a candle still reached below the band's high line, then the next two candles closed above it.
- SELL: a candle still reached above the band's low line, then the next two candles closed below it.
Choose the bands with Use Fast Band and Use Slow Band. The bands split filter takes a breakout only when the two bands are at least Min Bands Split points apart, which skips breakouts while the bands are tangled and there is no clear trend.
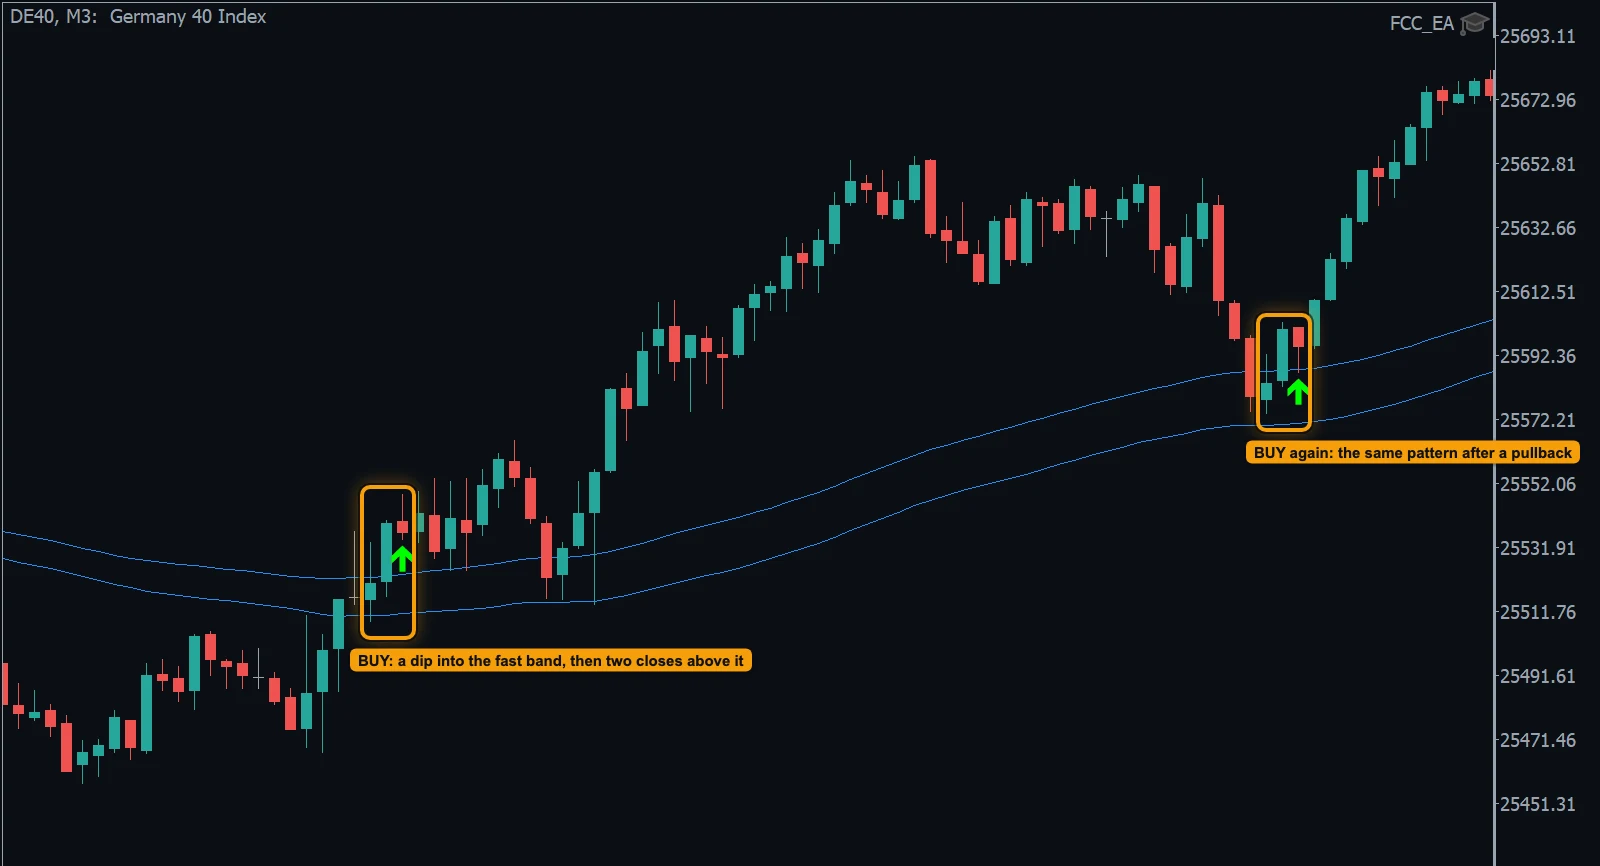
- BUY: a candle dips into the fast band, then two candles close above its high line.
- BUY again: the same pattern after a pullback to the band.
Band Cross
The fast band crosses the slow band completely:
- BUY: the fast band's low line crosses above the slow band's high line (the whole fast band is now above the slow one).
- SELL: the fast band's high line crosses below the slow band's low line.
Rare signals that mark a change of the bigger trend.
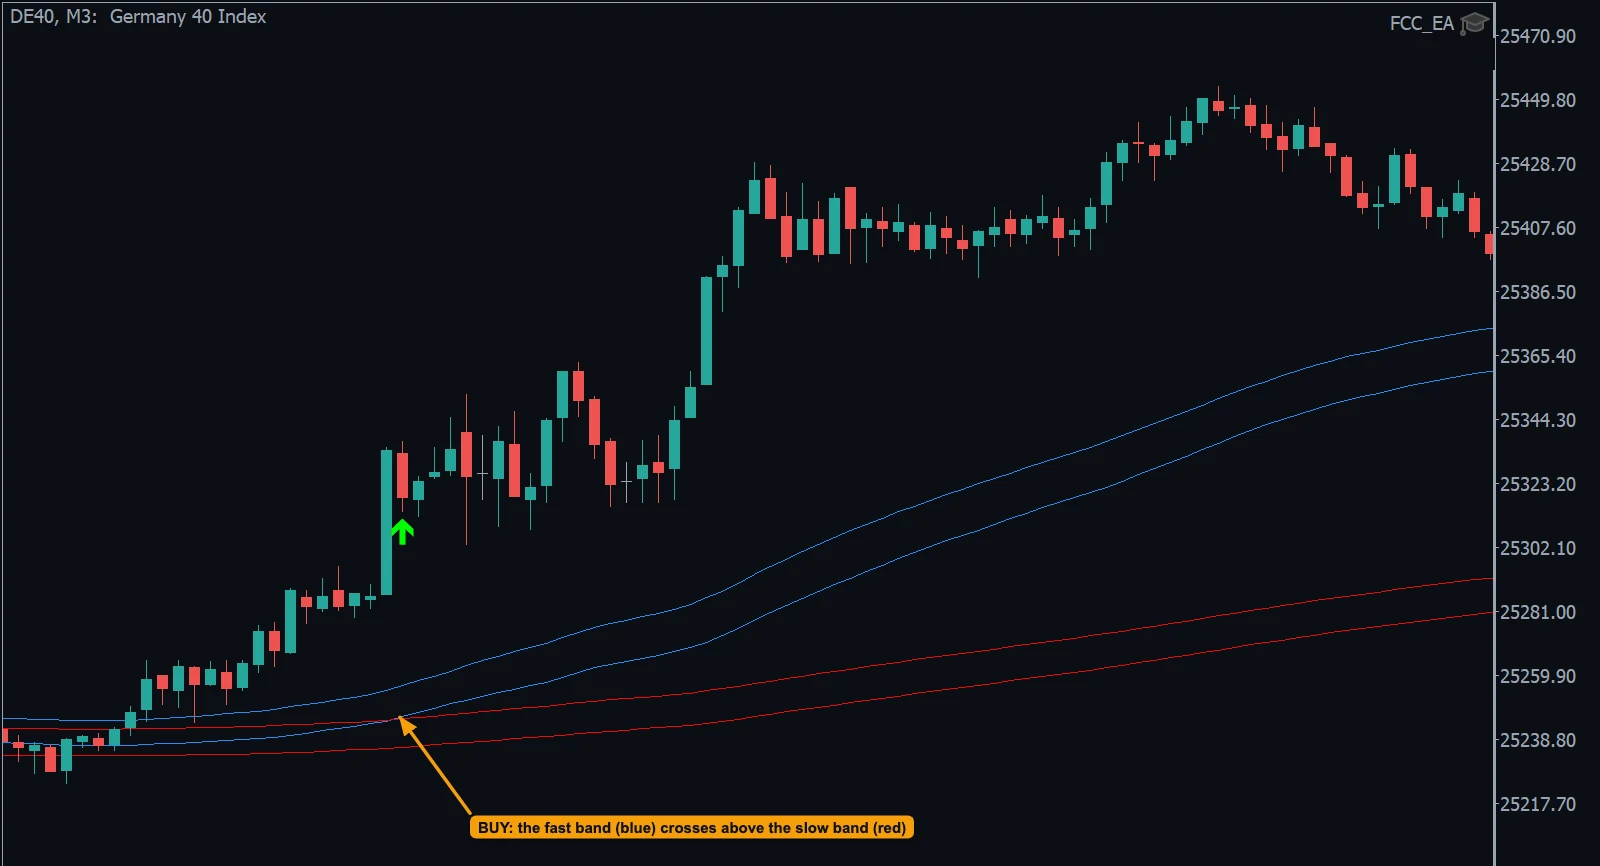
- BUY: the fast band (blue) crosses above the slow band (red); a long rally follows.
EMA Cross
The trigger EMA (EMA Settings) crosses a band edge:
- BUY: the EMA crosses above the band's high line.
- SELL: the EMA crosses below the band's low line.
Works on the bands you enable; EMA Cross Confirm (FILTERS) can wait a few candles before entering.
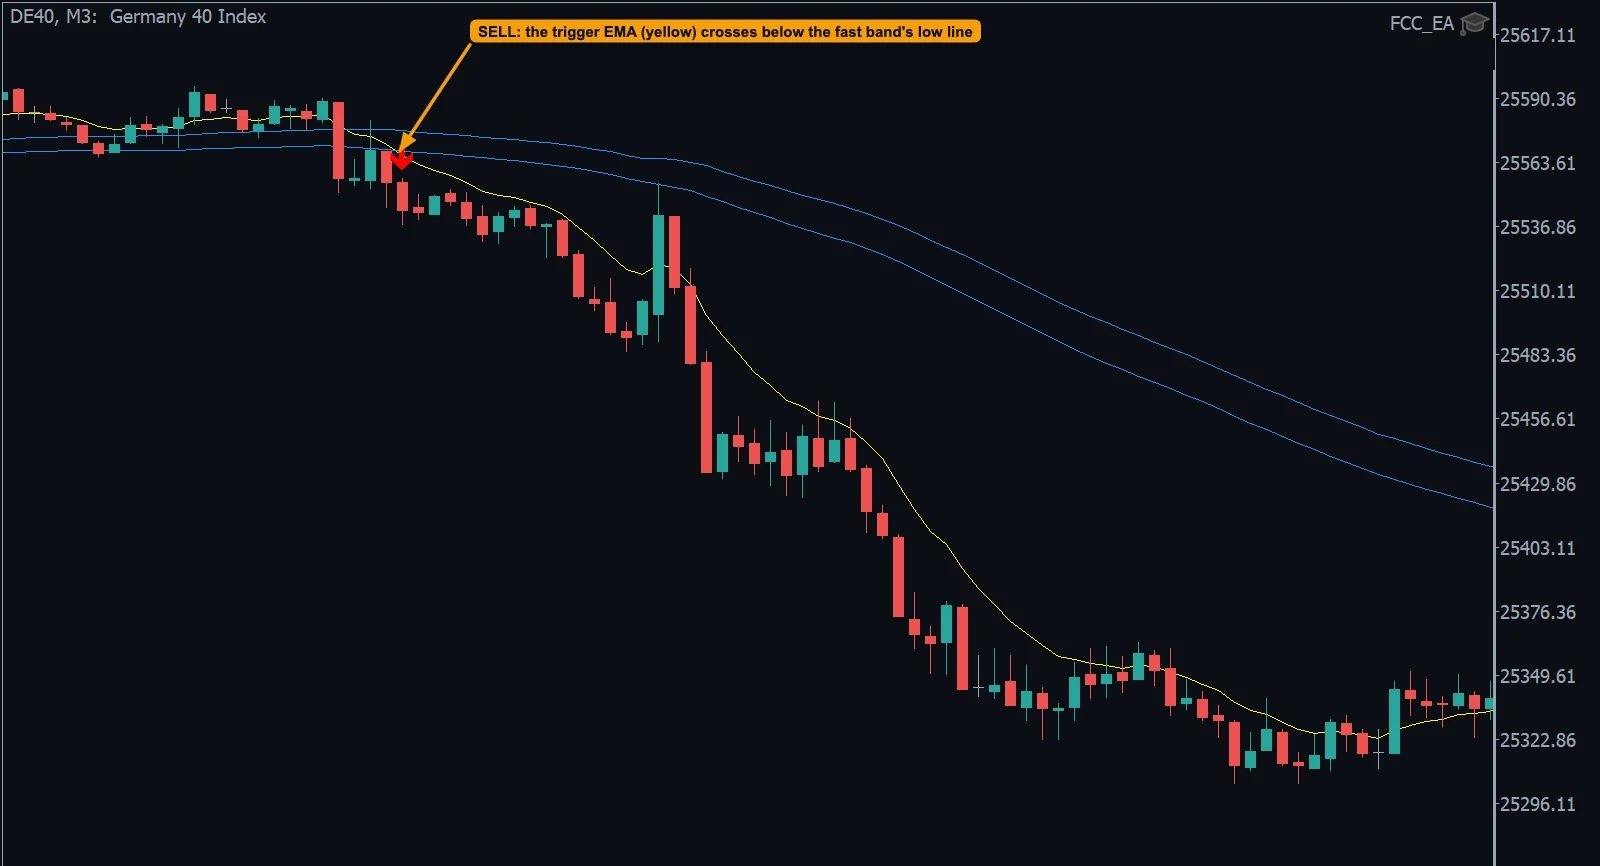
- SELL: the trigger EMA (yellow) crosses below the fast band's low line; the drop follows.
Seeing the bands
Turn on Display Fast SMMA (L/H)? and Display Slow SMMA (L/H)? in INDICATOR LINES. The current trend from the bands (on the Trend/Chop Timeframe) is shown as the Trend label at the top right of the chart.
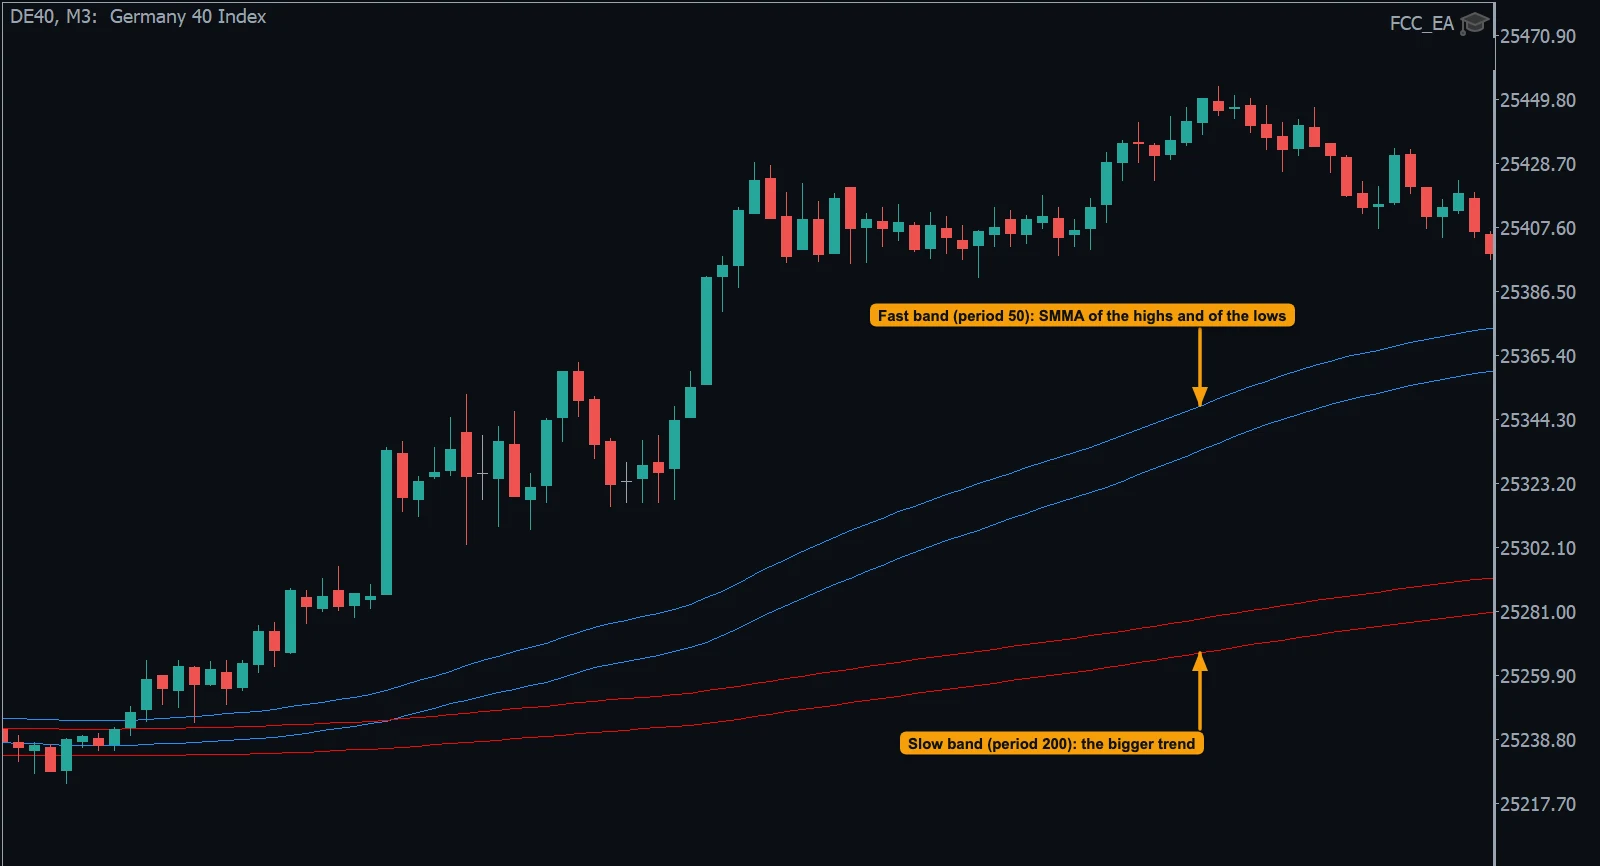
- The fast band: the SMMA of the highs and of the lows, close to price.
- The slow band: the bigger trend. Price above both bands = buyers in control.
Same bands, other uses
The two SMMA periods are also used by the Trend and Chop filters, the Fast SMMA Band filter and the SMMA Bands trailing stop, so changing them changes those too. Use case: FCC_EA for trend followers — the three SMMA triggers next to EMA and TMA.
All settings for this feature SMMA Signals settings →
Backtest this setup free in the Strategy Tester, and adjust it whenever the market changes; every feature is in every plan. Backtest results depend on your broker's data and don't guarantee future results.
Check the FAQ or write to us. We reply within one business day.