Indicators on the chart
FCC_EA can draw every line, band and zone its signals use. You see what the EA sees: why a trade was taken or skipped, and the same levels for your own trades from the Trading Panel.
- Drawing never changes a signal. Turning a line on or off only changes the chart.
- Any indicator can be shown with any signal method, also in Full mode. For example VWAP bands and liquidity levels on a chart that trades EMA Signals, or only indicators with Trading Mode = Trading OFF.
- Most are off by default: turn on the ones you want on the Inputs tab (F7 on the chart).
- Hover over a line to see its name, period or price; liquidity levels also show their direction and state.
Where each one is switched on
| Indicator | Setting (settings group) | More |
|---|---|---|
| EMA trigger and slow EMA | Display EMA Trigger Line?, Display EMA Slow Line? (INDICATOR LINES) | EMA Signals |
| Fast and slow SMMA bands (high and low lines) | Display Fast SMMA (L/H)?, Display Slow SMMA (L/H)? (INDICATOR LINES) | SMMA |
| VIDYA, TMA | Display VIDYA Line?, Display TMA Line? (INDICATOR LINES) | TMA |
| TMA-Bands with reversal arrows | Display TMA-Bands (line, bands, arrows)? (INDICATOR LINES) | TMA |
| Session VWAP and its ±1, 2, 3 σ bands | Display VWAP and Enabled Bands? (VWAP SIGNALS) | VWAP |
| Daily pivots PP, R1–R4, S1–S4, mid-pivots | Display Pivots?, Display Pivot Trigger Lines?, Pivot Mode (PIVOT SIGNALS) | Pivots |
| High and low of the two daily ranges | Display Range Breakout Levels? (RANGE-BREAKOUT SIGNALS) | Range Breakout |
| Liquidity levels: swings, PDH / PDL, PWH / PWL, sessions, custom range, open-hour and custom levels | Display Level Lines?, Display Level Labels? (LIQUIDITY SWEEP SIGNALS) | Liquidity Sweep |
| Rejection blocks (A+), up to three timeframes | Use Rejection Blocks A+? together with Display Level Lines? (LIQUIDITY SWEEP SIGNALS) | Liquidity Sweep |
| Order blocks with their Mean Threshold, up to three timeframes | Use Order Blocks? together with Display Level Lines? (LIQUIDITY SWEEP SIGNALS) | Order Blocks |
| Fair value gaps and inverted FVGs | Display FVG Boxes?, Display Inverted FVG (IFVG) Boxes? (FVG / IFVG) | VWAP |
The colors of the moving averages and TMA-Bands are set next to their switches. Indicator Lines: Bars to Display sets how far back those lines are drawn. They are calculated on the chart's own timeframe, so they match the standard indicator on that chart; the signals keep using the Signal Timeframe.
The VWAP setting draws the VWAP line and the bands that are switched on as triggers in the same group.
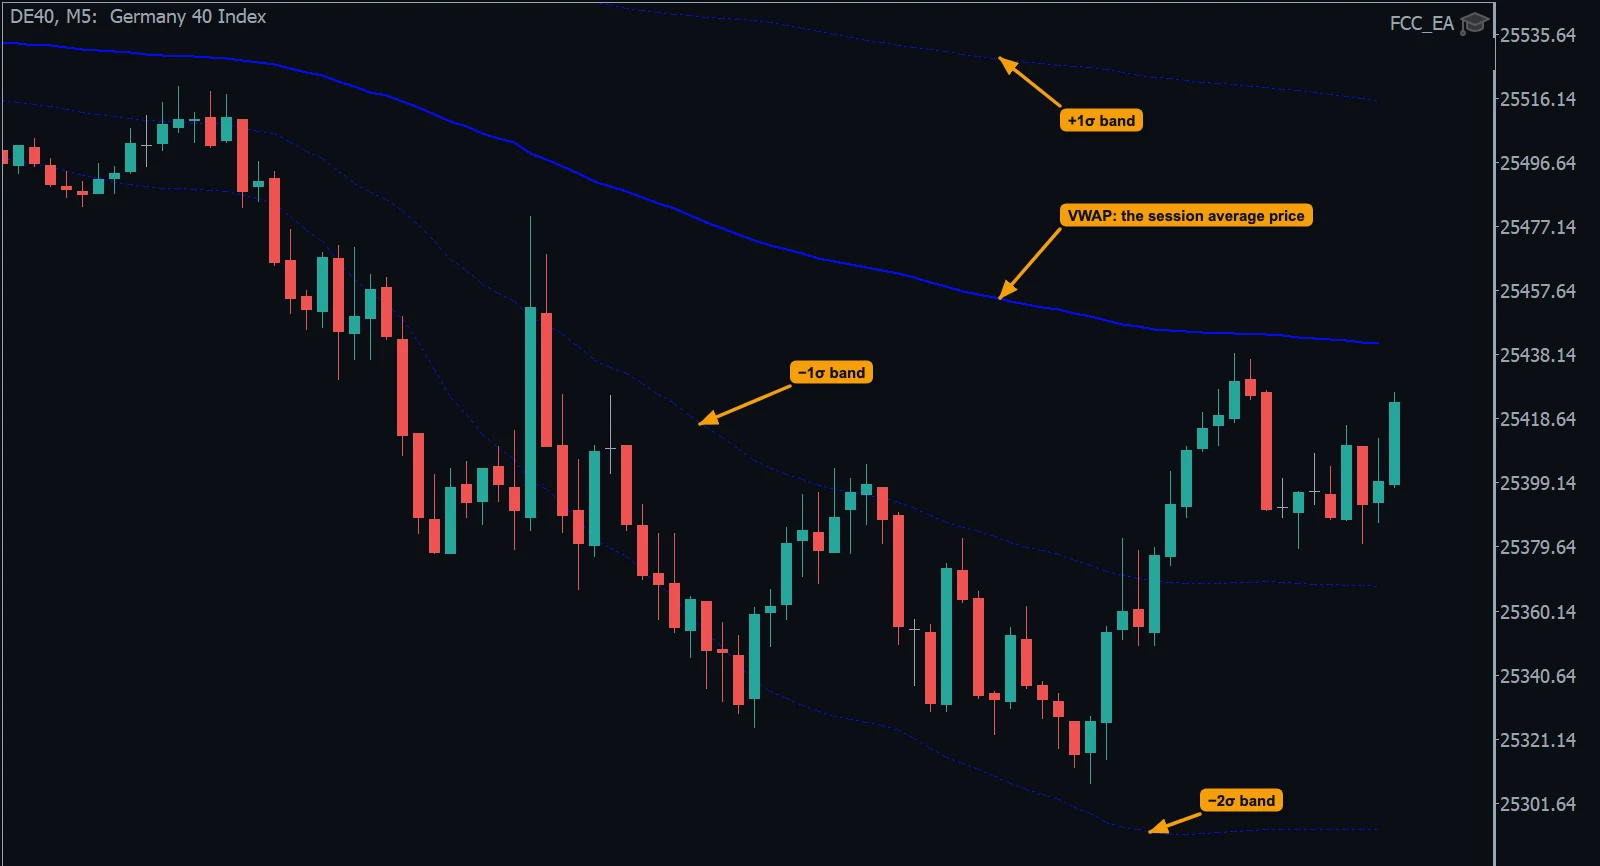
The session VWAP with its standard-deviation bands, drawn by FCC_EA on a DE40 M5 chart.
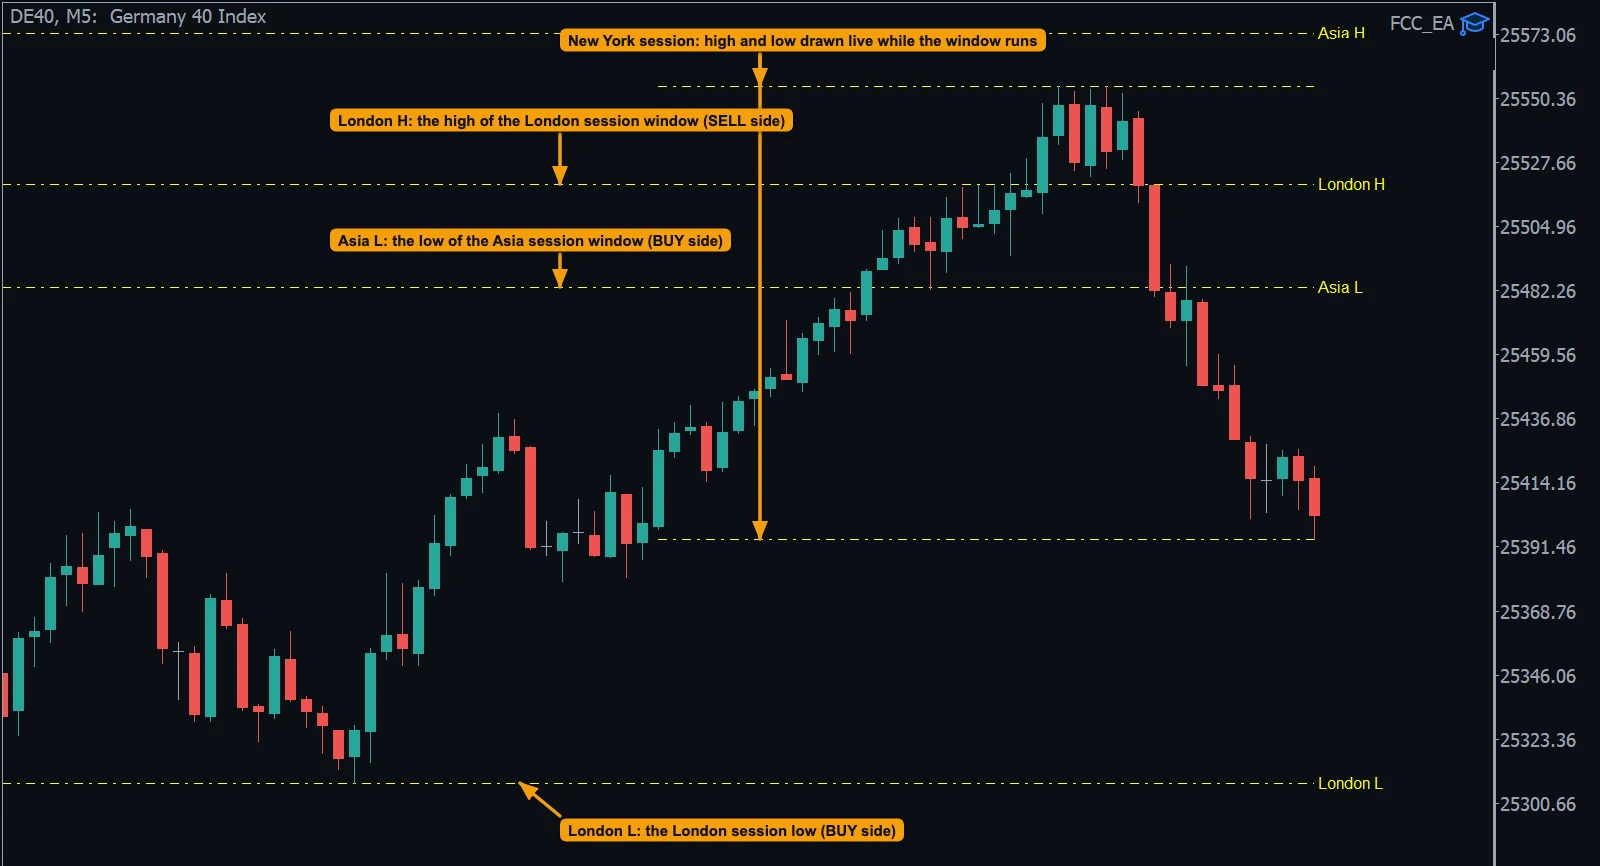
Liquidity levels with labels: the Asia, London and New York session highs and lows.
Signal previews
Two methods can also mark past signals with arrows, so you can see what a filter would do before you trade with it:
- Signal Preview: EMA Crosses (EMA SETTINGS): every EMA cross gets an arrow. With Slope Filter? on, crosses it blocks are grey; with it off, all arrows are colored.
- Display Signal Preview Arrows? (FVG / IFVG): every IFVG entry gets an arrow, colored if it passes the method's checks, grey if blocked. Hover over a grey arrow to see why.
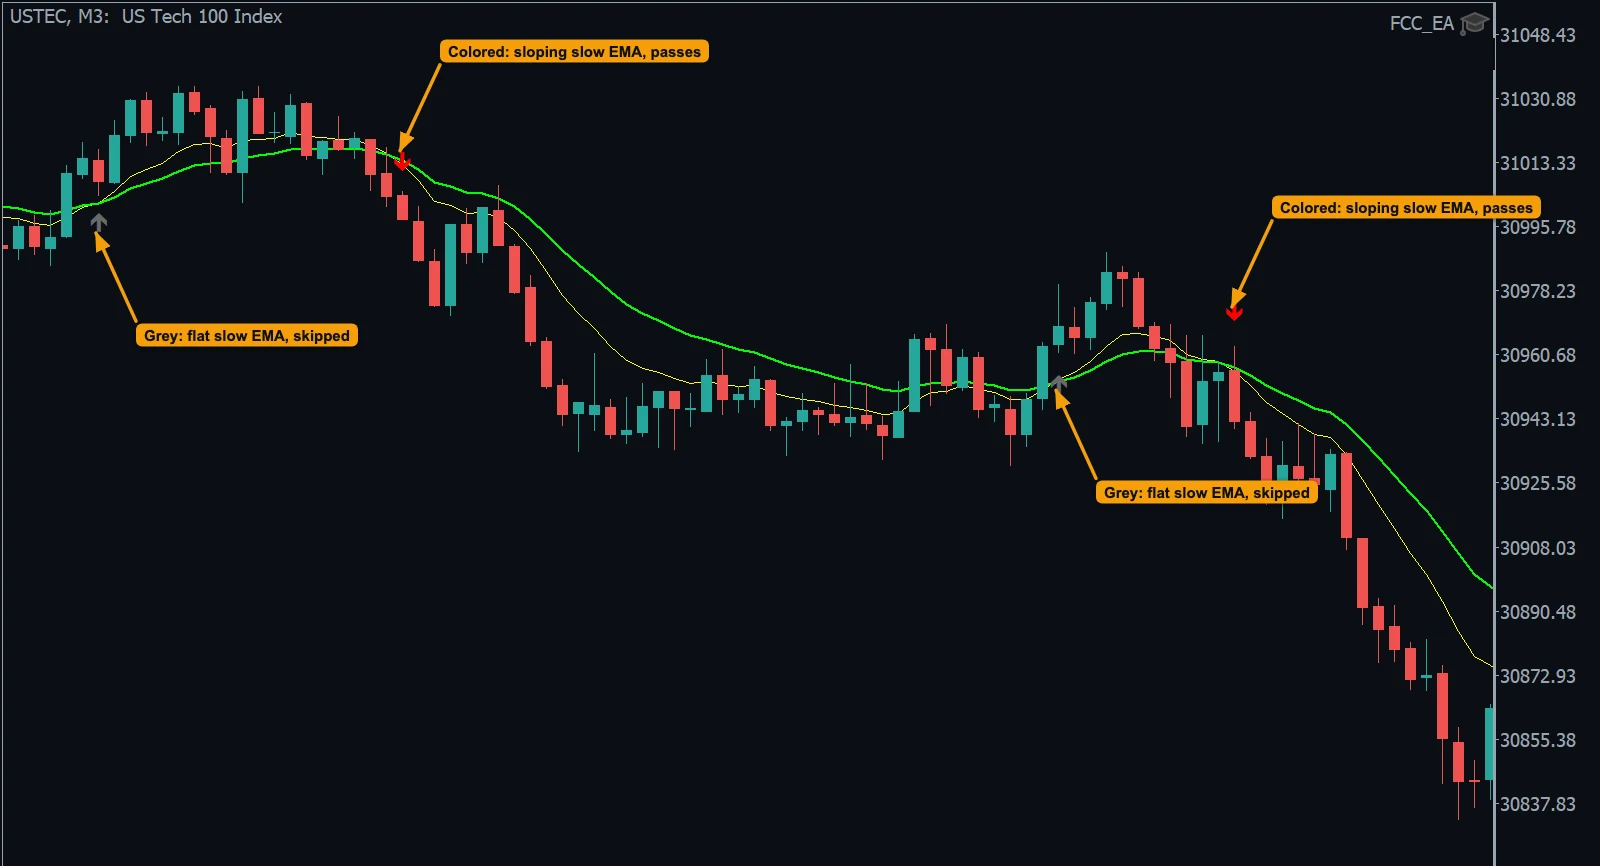
- Signal Preview: EMA Crosses: grey arrows where the slope filter blocks a cross in a sideways market, colored arrows where a cross starts a trend.
Signal Arrow Size (OTHER SETTINGS) sets the size of these arrows and of the TMA-Bands arrows.
Trade lines
For open trades FCC_EA also draws the levels it manages: the next grid level, the partial close price and, with virtual stops, the orange dotted stop or hedge level (Virtual vs physical orders).
Info panel and candle countdown
- Display Info Panel? (OTHER SETTINGS, on by default): the summary of the settings and the state, with the header that shows when FCC_EA may trade. See Read the info panel.
- Display Bar Close Countdown (OTHER SETTINGS): the time until the current candle closes, in the top-right corner, for the chart's timeframe or the Signal Timeframe.
- The
Trend:label at the top right shows the trend of the trend filters.
A busy chart
Turn on only what you use. Many lines on a small chart are hard to read, and every extra indicator costs the terminal a little time. A separate chart of the same symbol with FCC_EA in Trading OFF mode (and its own Magic Number) can show extra indicators without trading.
All settings for this feature Indicator Lines settings → EMA settings → VWAP Signals settings → Pivot Signals settings → Range-Breakout Signals settings → Liquidity Sweep Signals settings → FVG / IFVG settings → Other settings →
Backtest this setup free in the Strategy Tester, and adjust it whenever the market changes; every feature is in every plan. Backtest results depend on your broker's data and don't guarantee future results.
Check the FAQ or write to us. We reply within one business day.