EMA Signals method
EMA Signals is the default method and the simplest one: a fast EMA crossing a slow EMA. It suits trending markets and is a good method to learn FCC_EA with.
The signal
- The trigger EMA crosses above the slow EMA: BUY.
- The trigger EMA crosses below the slow EMA: SELL.
Both EMAs are calculated from closes of the Signal Timeframe, and the cross is checked when a candle closes: the last closed candle has the trigger EMA on the new side, the candle before it on the old side.
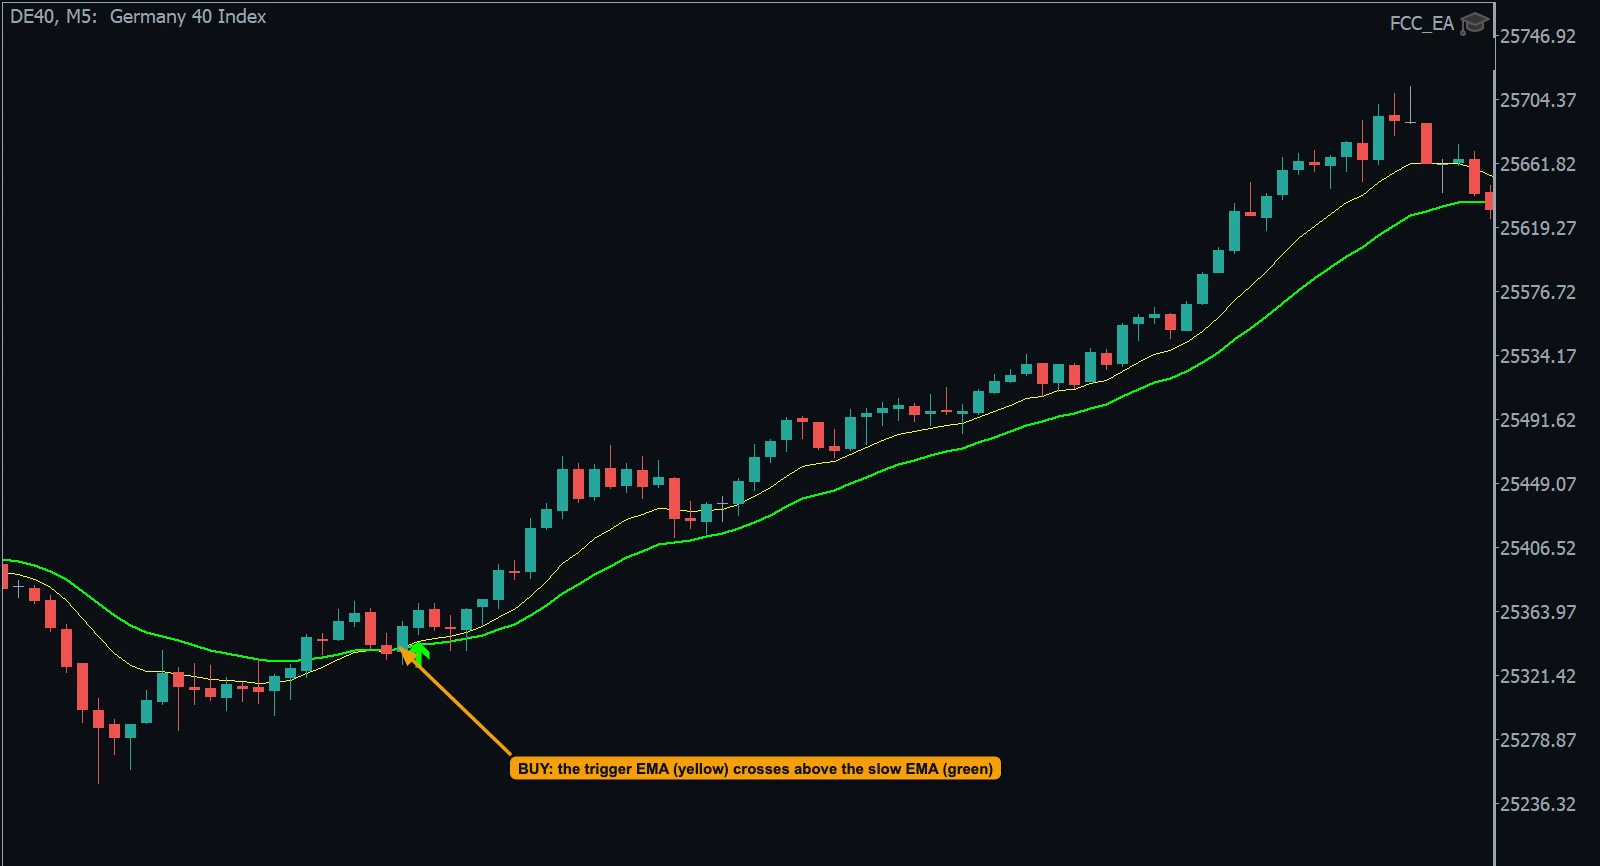
- BUY: the trigger EMA (yellow) crosses above the slow EMA (green); the uptrend follows.
The problem: sideways markets
When the market moves sideways, the two EMAs weave around each other and every small wiggle is a cross. Two tools help:
- Slope Filter?: skips a cross while the slow EMA is flat; a higher Slope: Min Move per Bar is stricter, and one value works on any symbol and timeframe.
- EMA Cross Confirm: Wait N Bars and Re-Check (FILTERS): waits a number of candles after the cross and enters only if the trigger EMA is still on the new side.
Choose the slope threshold with the preview
- Switch Slope Filter? on and set Signal Preview: EMA Crosses to On.
- Every past cross gets an arrow: colored = the slope filter lets it through, grey = it blocks it. Hover over an arrow to see the measured slope and the threshold.
- Change Slope: Min Move per Bar until the grey arrows are mostly the sideways crosses you want to skip. With Slope Filter? off, every arrow is colored.
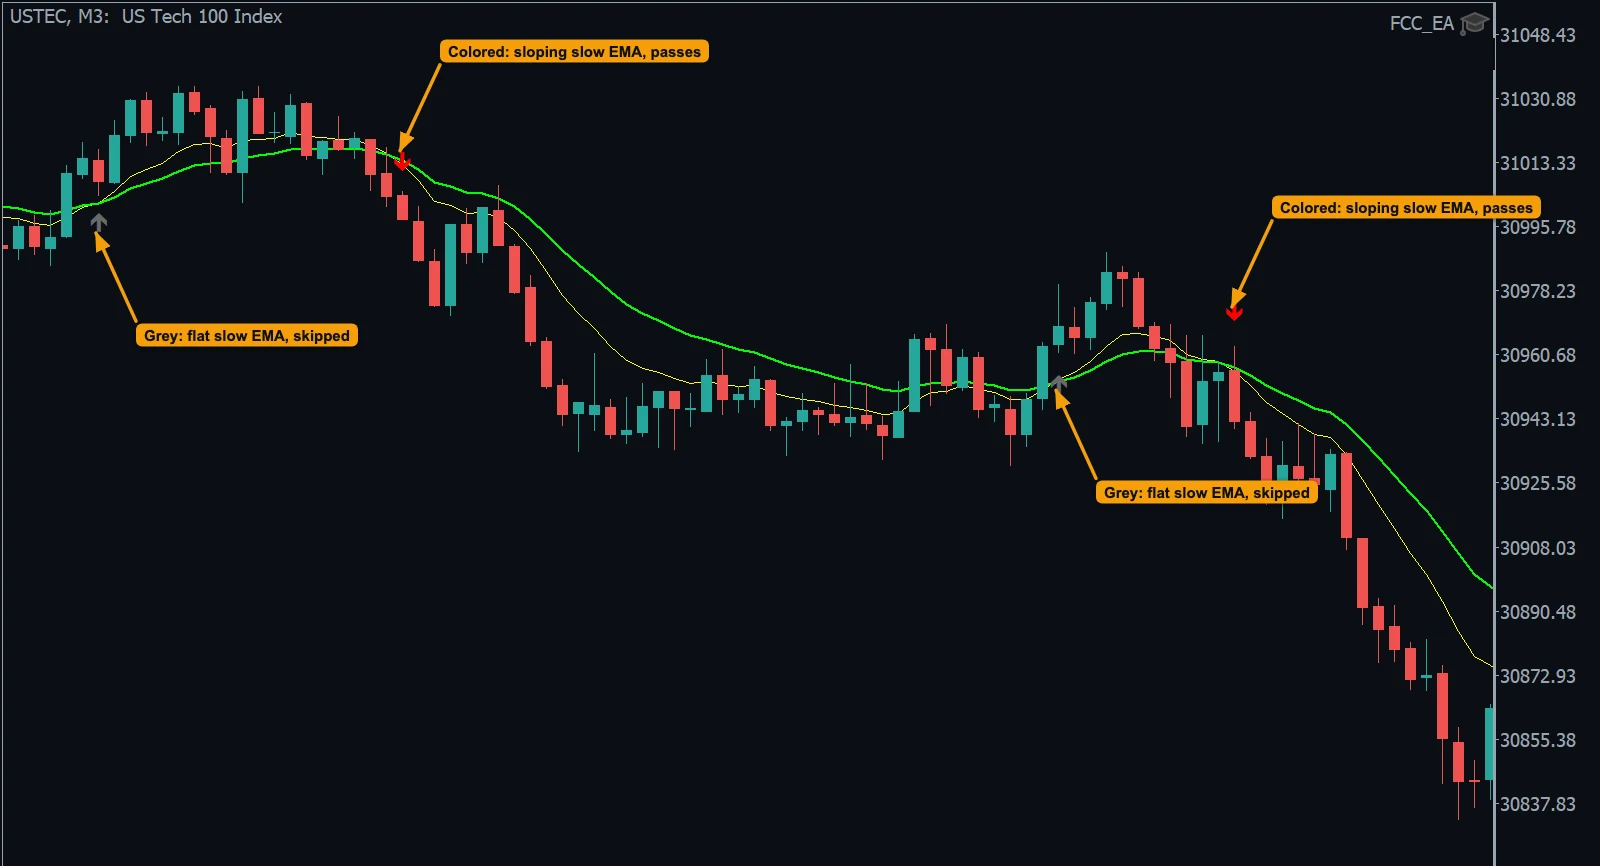
- Grey: the slow EMA is flat, so the slope filter would skip this cross (sideways market).
- Grey again: another flat-market cross, skipped.
- Colored: the slow EMA is sloping, the cross passes and the drop follows.
- Colored: the next passing cross, again followed by the move. Threshold here: Slope: Min Move per Bar 0.03.
Seeing the lines
Turn on Display EMA Trigger Line? and Display EMA Slow Line? in INDICATOR LINES. They are drawn on the chart's own timeframe, so on a chart that differs from the Signal Timeframe they will not match the signal crosses exactly; put the chart on the Signal Timeframe to compare.
Starting points
- Start with the default periods and compare a few Signal Timeframes in the Strategy Tester and on demo before you change the periods.
- Turn on the slope filter with a threshold picked from the preview.
- Combine with breakeven or trailing so a trend that turns does not give back the whole move. Use case: FCC_EA for trend followers — EMA crosses, SMMA bands and TMA / VIDYA side by side.
All settings for this feature EMA settings → Filters settings →
Backtest this setup free in the Strategy Tester, and adjust it whenever the market changes; every feature is in every plan. Backtest results depend on your broker's data and don't guarantee future results.
Check the FAQ or write to us. We reply within one business day.