Grid trading (averaging)
Available in FCC_EA Trading Panel Pro Trading Panel Free (basic)
Trading Panel Free: grid on or off, the number of orders, the distance between them, the lot multiplier and the grid lines. The distance multiplier, one order per candle, the breakout bar filter and the grid timeframe are in Pro and FCC_EA.
When price moves against an open trade, the grid adds more positions in the same direction at set distances. The average entry gets better, and all positions share one take profit at that average, so a smaller move back closes the whole group in profit.
A grid does not make a losing trade safer. If price keeps going against you, the loss grows faster than with a single position, and with a lot multiplier above 1 much faster. Always keep a stop loss, and test your settings on a demo account first. FCC_EA cannot promise any result.
How the grid adds positions
- The next grid position opens when price is Min Distance Between Grid Orders points against the newest position in that direction.
- Its lot is the first position's lot × Grid Lot Martingale Multiplier for the 1st grid position, × Grid Lot Martingale Multiplier² for the 2nd, and so on. With 1.0 every position has the same lot.
- With Grid Distance Martingale Multiplier above 1 the distance grows the same way: 500, then 750, then 1125 points with 1.5.
- Max Grid Orders is how many positions can be added to the first one, per direction: 3 = the first position + three grid positions.
The grid works for every position FCC_EA opens on the chart: signal trades, Trading Panel trades and add-on positions. The first position's lot is the base, so a Trading Panel trade with its own lot grows from that lot.
One take profit, one stop
- Take profit: after each grid add, the TP of all positions moves to their average entry ± Take Profit. See Stop loss and take profit.
- Stop loss: each grid position copies the stop price of the first position. When price reaches it, the whole group closes there.
- Breakeven and trailing measure from the average entry, and a partial close can happen once more after each grid add.
All grid positions must open before price reaches the stop. With Stop Loss = 1000 and Min Distance Between Grid Orders = 500, the second grid position would open right at the stop. Keep the sum of the grid distances clearly smaller than the stop loss.
Example in numbers
BUY 0.10 lot at 1.10000 on EURUSD, Min Distance Between Grid Orders 500, Max Grid Orders 3, Take Profit 1000, Stop Loss 2000 (stop at 1.08000):
| Equal lots (Grid Lot Martingale Multiplier 1.0) | Doubling lots (Grid Lot Martingale Multiplier 2.0) | |
|---|---|---|
| First position | 0.10 at 1.10000 | 0.10 at 1.10000 |
| Grid 1 at 1.09500 | 0.10, TP of all 1.10750 | 0.20, TP of all 1.10667 |
| Grid 2 at 1.09000 | 0.10, TP of all 1.10500 | 0.40, TP of all 1.10286 |
| Grid 3 at 1.08500 | 0.10, TP of all 1.10250 | 0.80, TP of all 1.09867 |
| Open in total | 0.40 lot | 1.50 lot |
| Loss if the stop is hit | about $500 | about $1,300 |
A single 0.10 lot position with the same stop would lose about $200. The figures are before spread, commission and swap; on EURUSD one point of one lot is worth about $1.
Fewer adds into a falling market
- One Grid Order per Candle? (on by default): at most one grid position per candle of the Grid Timeframe, so a fast move does not open several at once.
- Grid Breakout Bar Filter?: price must be at the grid distance and show a first sign of a turn. A BUY grid position opens only when price breaks above the previous candle's high (a SELL one below its low).
The Grid Timeframe only sets the candles of these two options; it does not change the distances.
On the chart
With Display Grid Lines? on, FCC_EA draws the level of the next grid position, or with All grid lines the levels of all the remaining ones. The Experts tab logs each add, for example Grid: BUY 0.20 at 1.09500 (grid position 2).
After the first grid add
With All grid lines, every level the grid can still use is on the chart before price gets there.
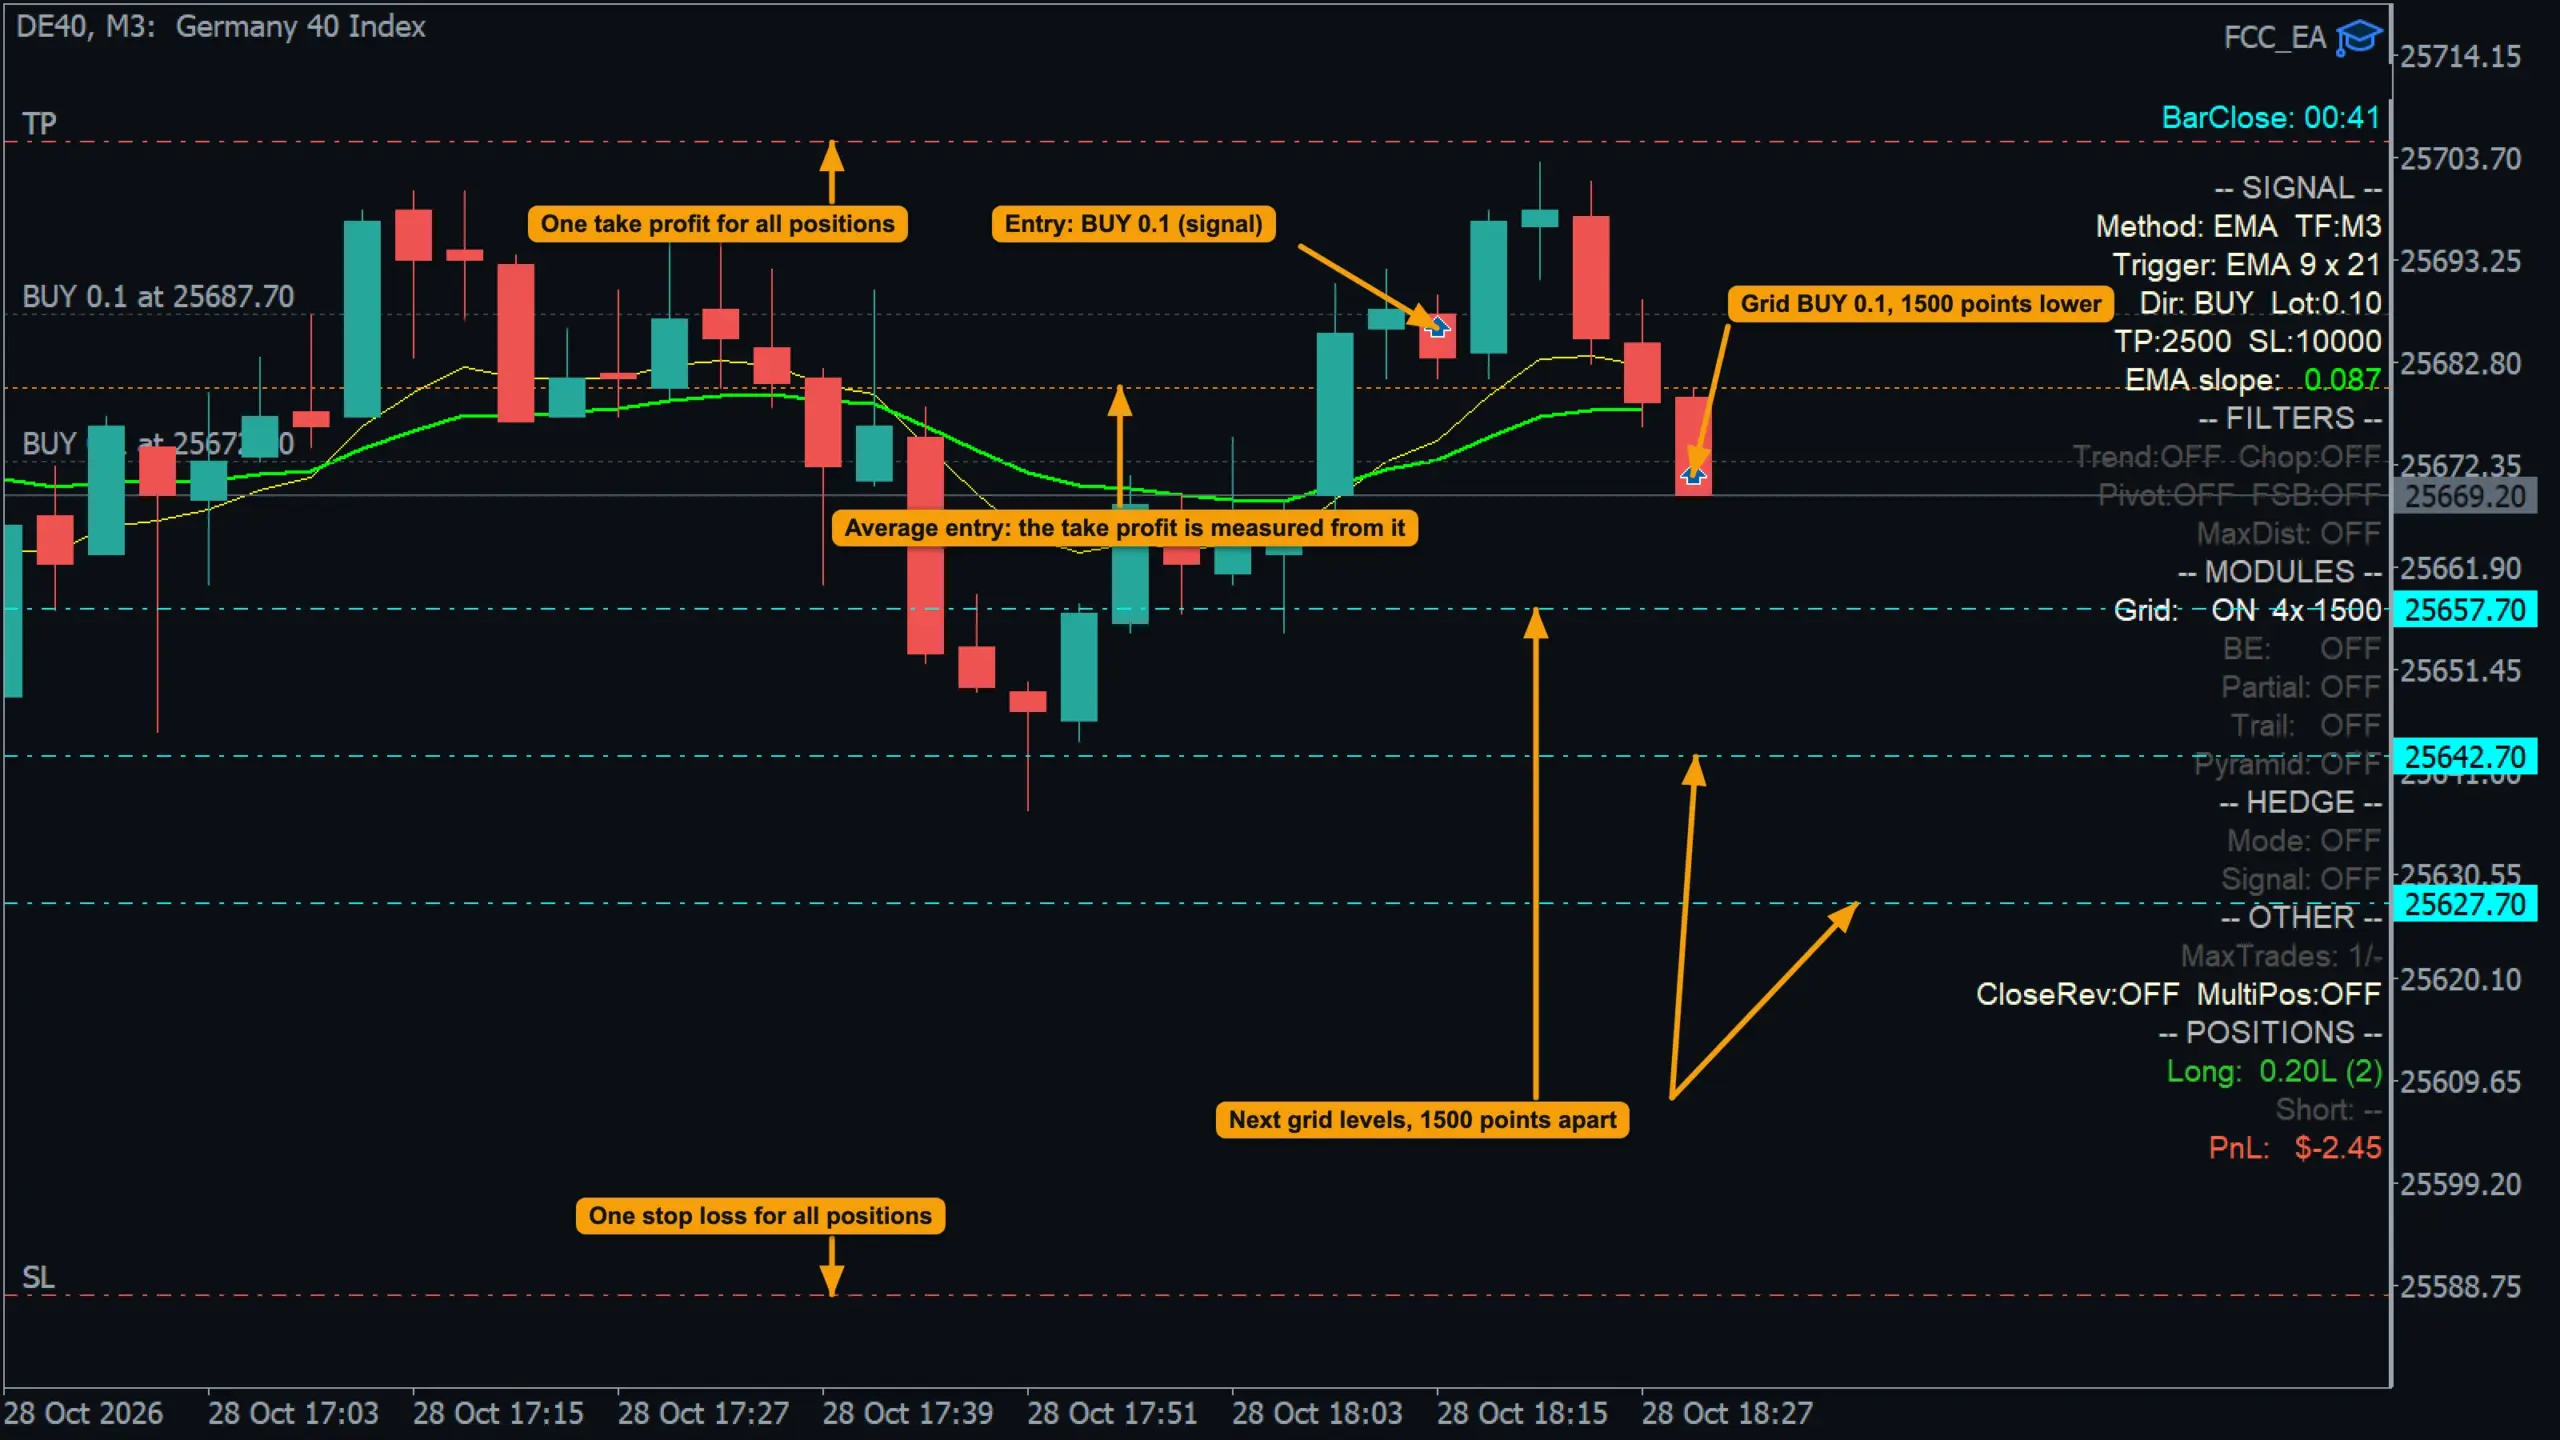
- Entry: BUY 0.1 from an EMA signal.
- Grid BUY 0.1: added when price fell Min Distance Between Grid Orders (1500 points = 15 index points) below the entry.
- Next grid levels: with Max Grid Orders 4 and Grid Lines Display Mode = All grid lines, the three levels still left are drawn, each 1500 points lower.
- Average entry of all positions: the take profit is measured from it.
- One take profit and one stop loss for all positions. Here price came back up and the group closed at the take profit.
Three positions open
With two grid adds, fewer levels are left to draw.
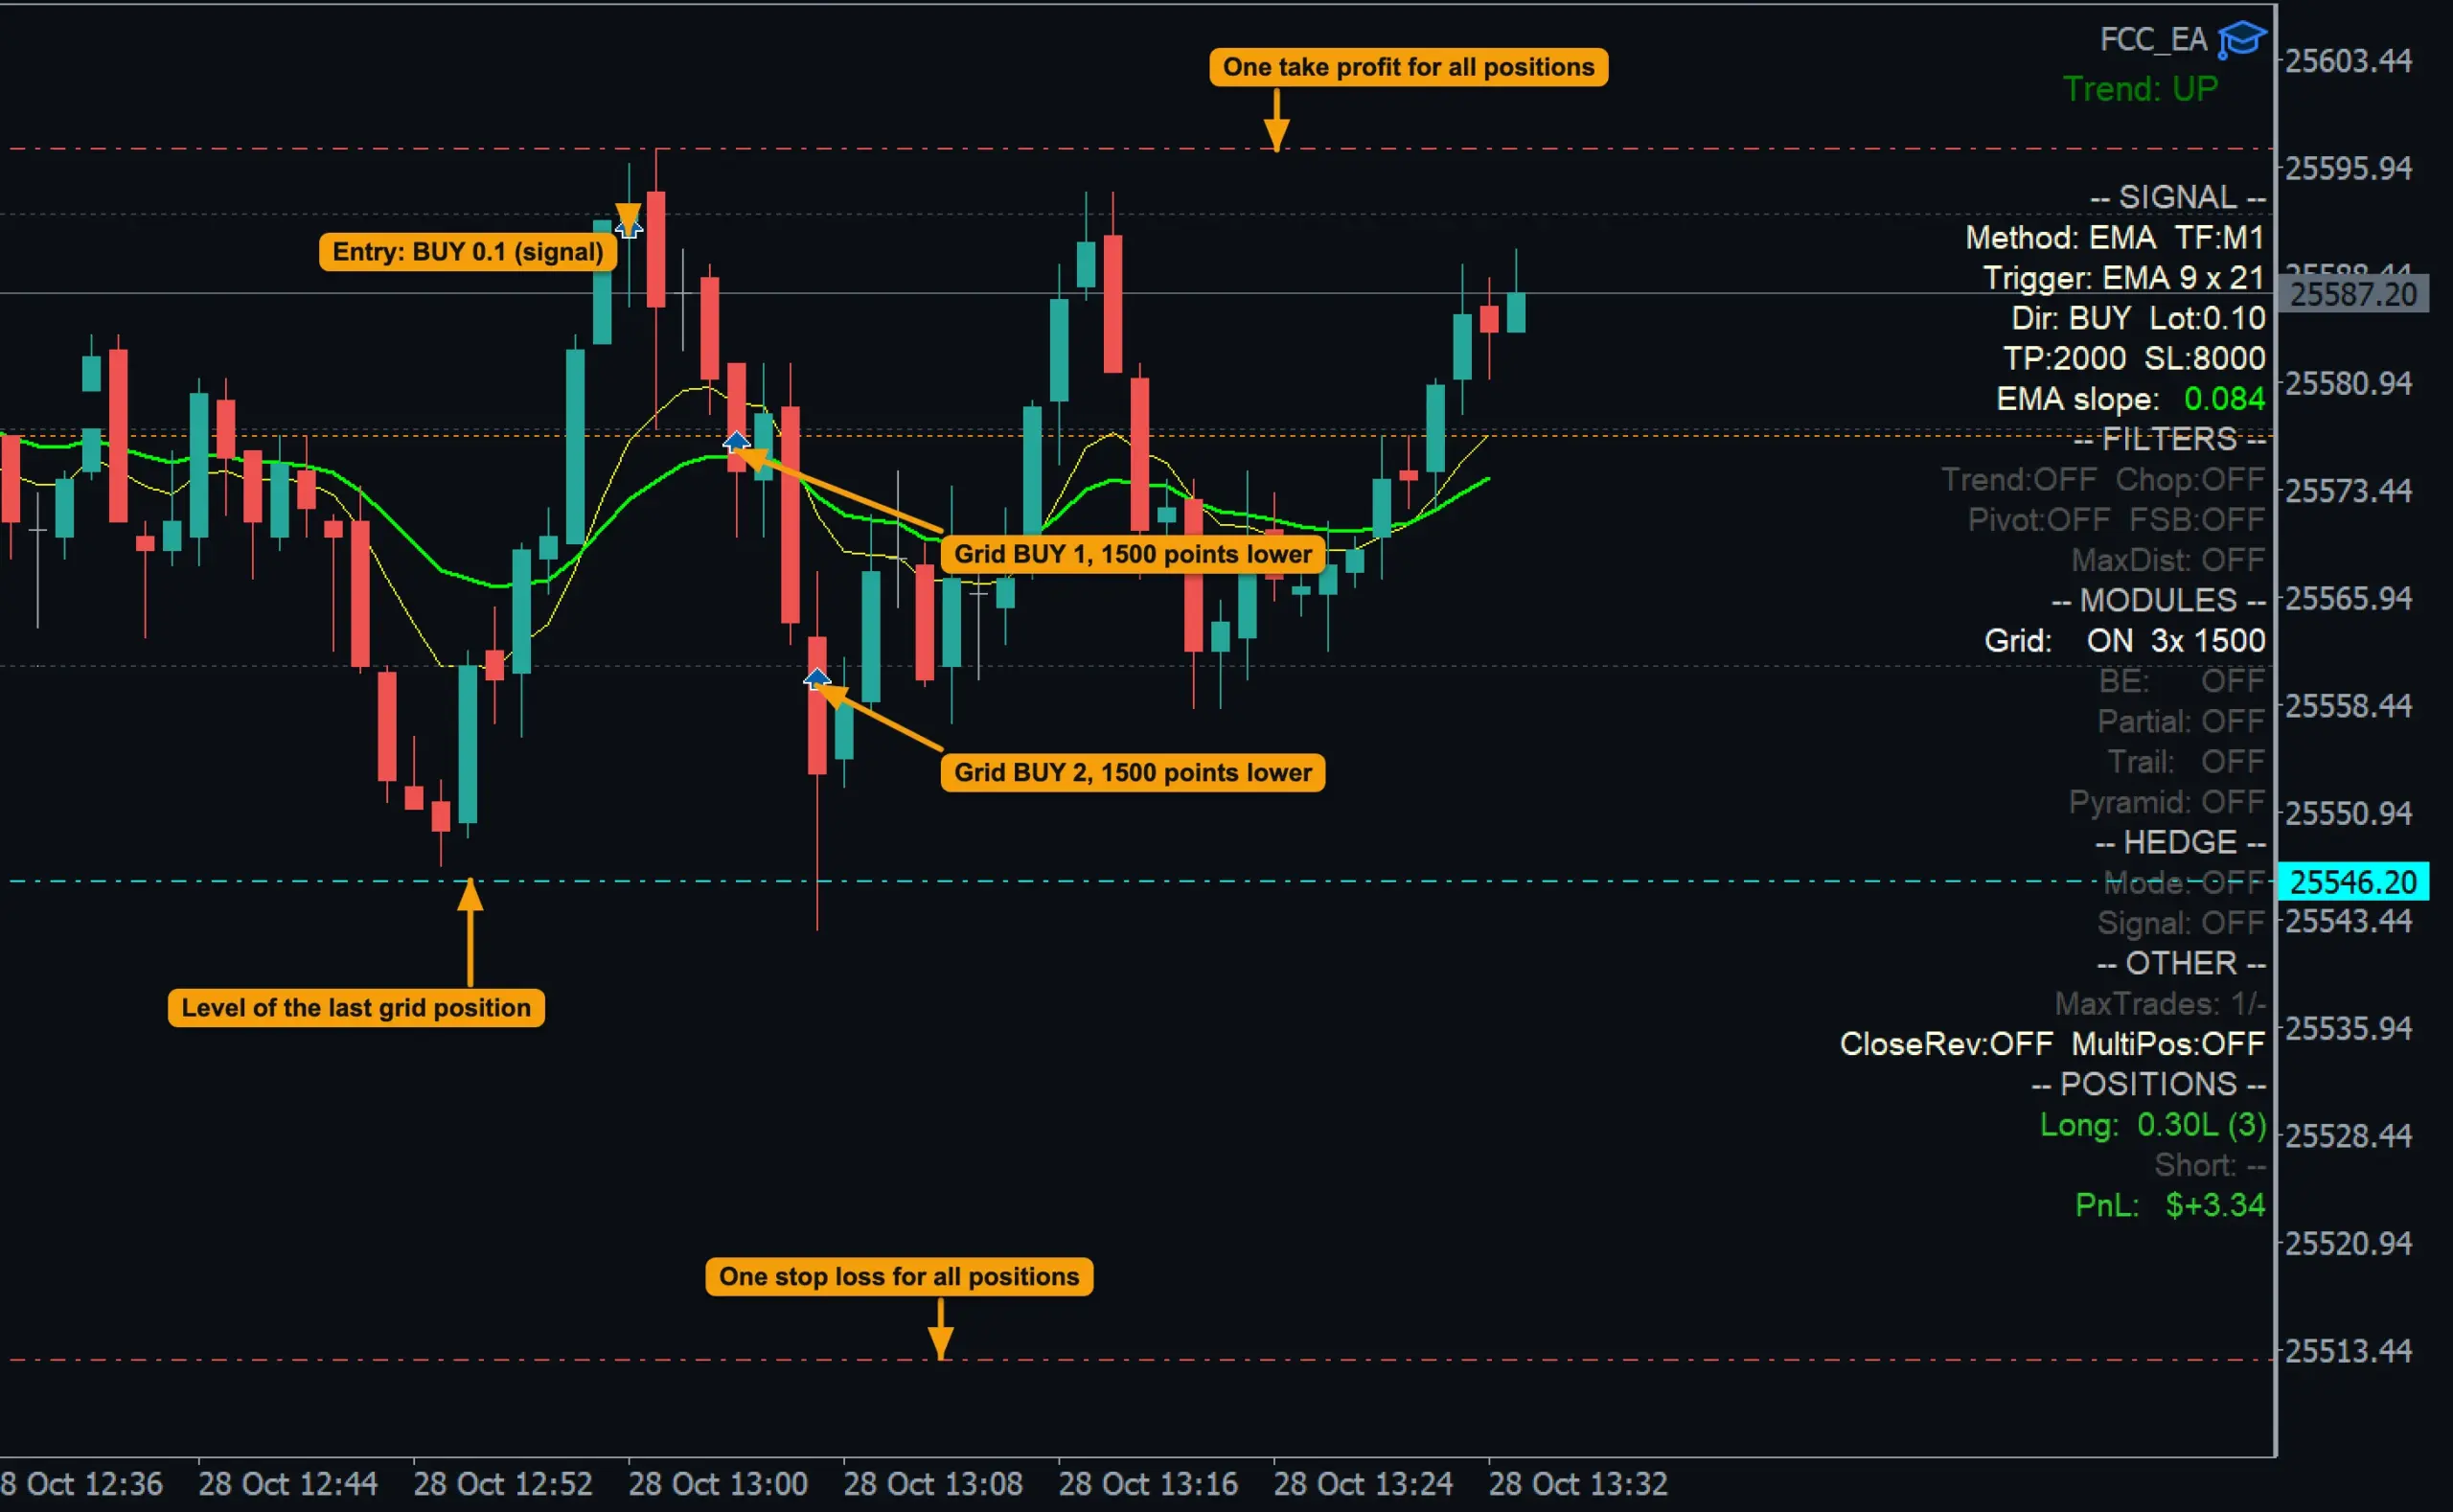
- Entry: BUY 0.1 from an EMA signal.
- Grid BUY 1 and 2: each added when price fell Min Distance Between Grid Orders (1500 points = 15 index points) below the newest BUY.
- Level of the last grid position: with Grid Lines Display Mode = All grid lines, every remaining level is drawn (here one is left of Max Grid Orders 3).
- One take profit and one stop loss for all positions.
With hedge mode and manual trading
- The grid stops adding when a hedge cycle becomes active; from then on the hedge basket is managed as a whole. See Hedge mode explained.
- In Manual trading (Panel) mode the GRID values of the Trading Panel MANAGEMENT section (distance, max) replace Min Distance Between Grid Orders and Max Grid Orders.
- Pyramid and add-on positions added to the same group use up places in Max Grid Orders too.
All settings for this feature Grid settings →
Backtest this setup free in the Strategy Tester, and adjust it whenever the market changes; every feature is in every plan. Backtest results depend on your broker's data and don't guarantee future results.
Check the FAQ or write to us. We reply within one business day.